

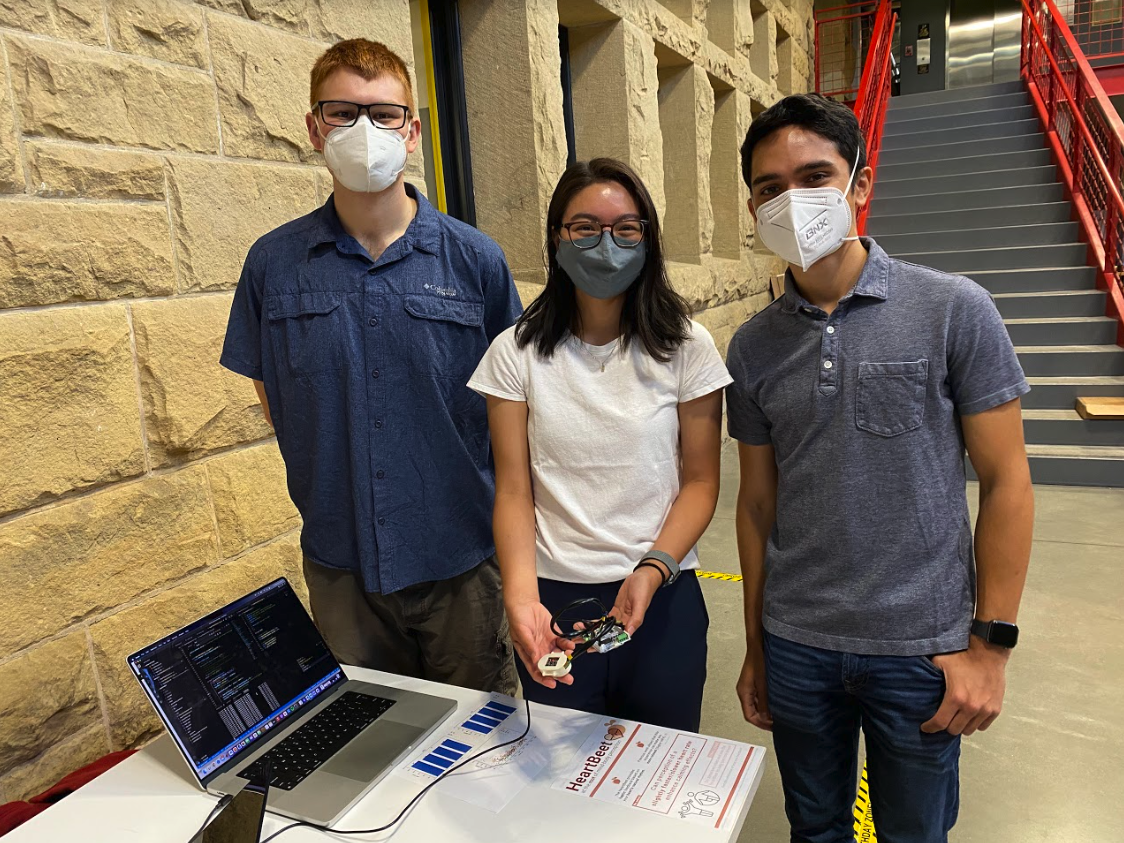
Group 11
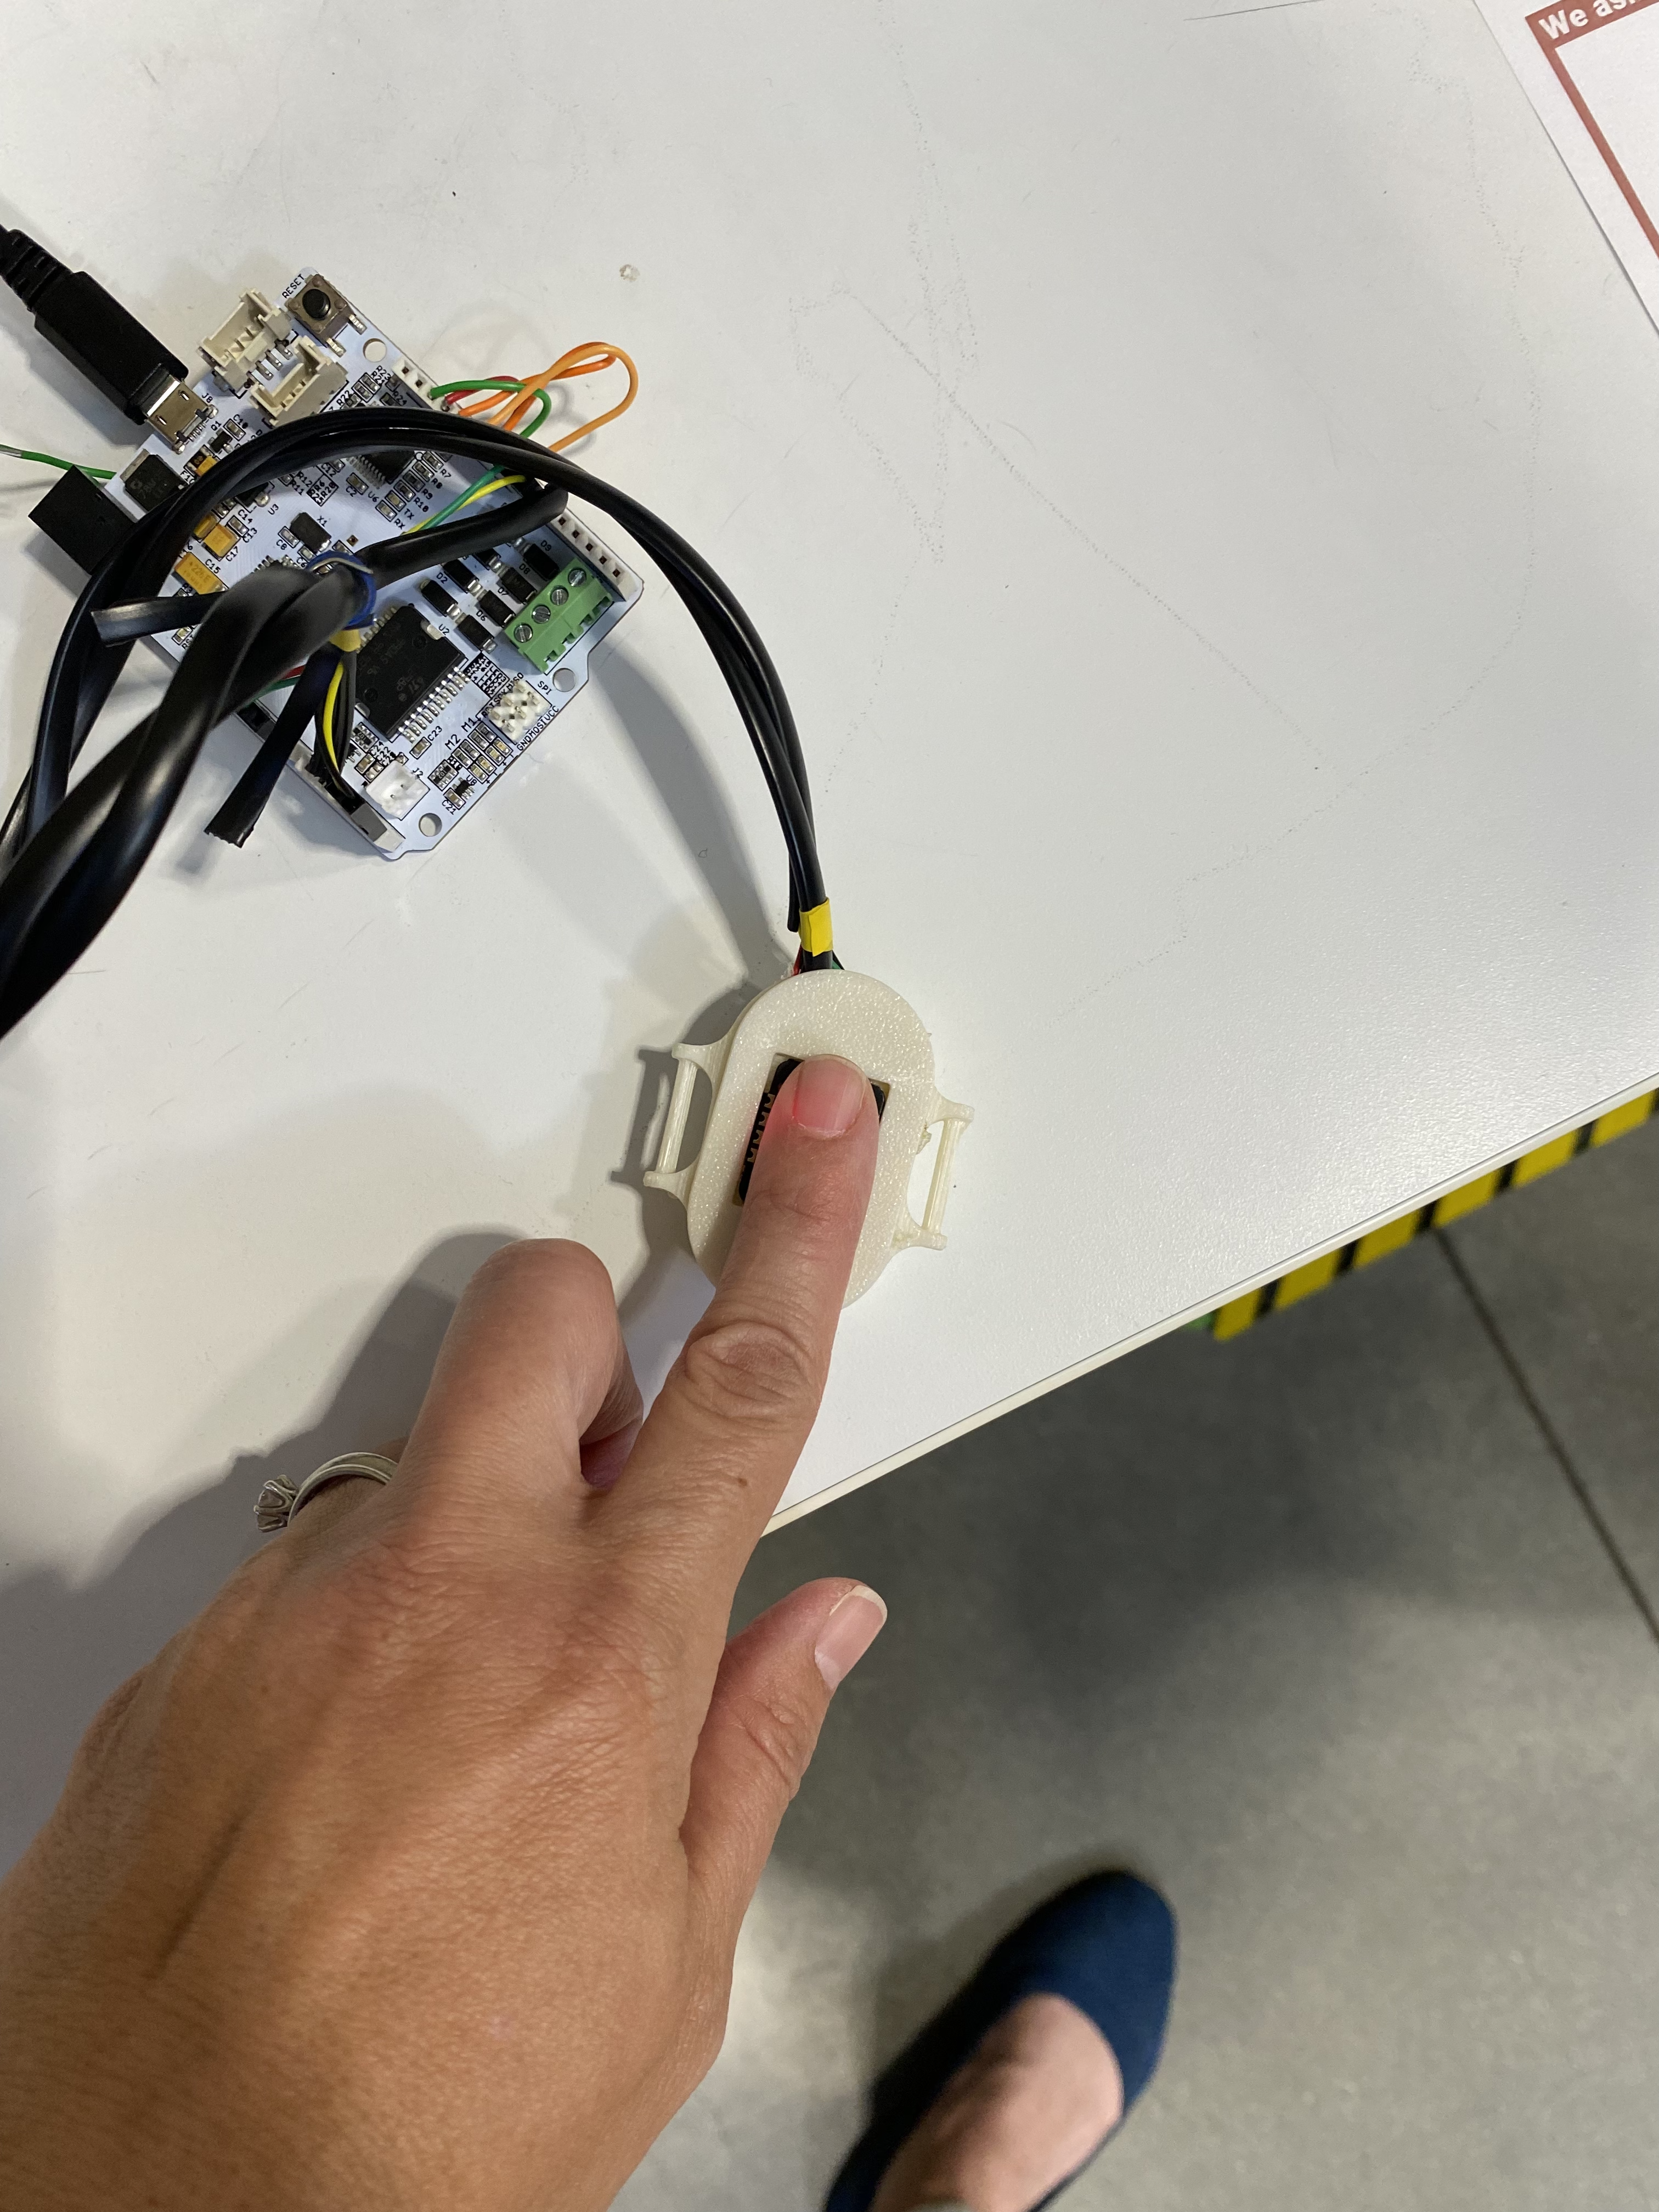
The HeartBeet in use,
measuring and providing
heart rate feedback.
HeartBeet
Project team members: Bianca Yu, Josh DeWitt, Russell Martin
The goal of this project is to better understand how vibratory heartbeat feedback can be used to elicit an affective outcome in a person, by either heightening their arousal or calmness. To accomplish this, we built the HeartBeet, which serves two functions: (1) acquire the user’s heart rate (HR) and heart rate variation (HRV) using a absorbance sensor, and (2) attempt to modulate the user’s HR, HRV, and self-reported stress levels by providing vibratory feedback of the user’s own heartbeat. Using this device, we sought to explore how modifying this vibratory feedback to be slightly slower or faster than the user’s true heart rate affects the user's stress (measured using HR, HRV, and a survey) in a range of experiments. We found that this device can elicit changes in HRV, but a larger sample size is needed to determine how this device can influence stress levels.
On this page... (hide)
Introduction
The human heart, and a person’s perception of heart rate have long featured in scary movies and videogames, having an intrinsic link to our physiological state. Understanding, and even manipulating our perception of our heart rates is a field of affective haptics with lots of room for growth. As smart watches, and other devices with both hear rate sensors and haptic vibration motors become more widespread, how can we use a user’s hear rate to amplify a desired effect?
While we have found studies that looked at constant heart rate feedback, we wanted to explore the effects of changing the perceived heart rate. Our device needs to sense a person’s heart rate in real time, and be able to provide haptic vibration feedback in kind. A simple keyboard test harness can be used to change the settings of the feedback (relative speed) during the experiment, to test various conditions. The device should be small and easy to wear/hold, approximating a watch or other wearable device.
Background
Zhou et al. (2020) is the main source of inspiration for our project. In this study, the authors characterized the relationship between perceived heartbeat vibration and physiological stress response. They created a device that allows users to experience their own heartbeats via (1) vibrations and (2) auditory feedback while in a relaxed state (i.e. sitting in a chair). Heart rate variability (HRV) was measured throughout each trial to assess changes in physiological reactions from an initial baseline. The authors found that heartbeat vibration significantly impacted HRV, indicating that users became more physiologically relaxed. On the other hand, listening to one’s heartbeat sounds had no significant effect on HRV, supporting the increased efficacy of vibratory haptic heartbeat feedback as a physiomodulatory mechanism.
Azevedo et al. (2017) built a device similar to what we are proposing: a wrist-worn device that reads the user's HR and returns a vibratory stimulus based on the user’s HR. This vibratory feedback was shown to significantly reduce physiological (skin conductance) and subjective measures of stress in a simulated public speaking study when compared to participants who did not receive feedback. However, the experimental group in the study only received one condition - the vibratory heartbeat was set to 20% slower than the user’s true heartbeat, and no other rates were explored. Additionally, the participants in this study only used the device on or off (i.e. data was unpaired) which may reduce the number of inferences we can make about the study’s effect on individual users’ physiological response.
Takeya et. al (2017) focuses on reactive or predictive responses to temporal stimuli in monkeys, and is a jumping off point to Savage et. al. (2015), which discusses statistical universals in music. These two studies point to the intrinsic ability of humans to internalize rhythms they are exposed to, which is something seemingly unique to humans (and parrots).
Yoon et. al. (2019) investigates the heartbeat synchronization between co-sleepers, demonstrating that there is a strong (2x time synchronized) subconscious autonomic connection for people sharing a bed versus sleeping separately. This study shows that even almost imperceptible haptic (ballistocardiographic) interaction between sleepers can influence the heart and autonomic system. Our device focuses on a more noticeable feedback, which could provide a more immediate HR response, or another avenue to explore (subtle nighttime heartbeat suggestions).
Methods
Provide a detailed description of your project, such that another student from the class could generally re-create your project/experiment from the report if necessary. (You don't need to document every screw, but the design should be clear.) Add images and videos as needed to support the description. You can refer to downloadable drawings and code in the "Files" section (later). You should divide this section into subsections, which can vary depending on your particular project. Here is an example set of subsections:
Hardware design and implementation
HR and HRV Calculation
The SPO2 sensor, the MAX30102, uses an Arduino library to communicate over I2C. This library also includes a peak detection algorithm, which uses simple filtering and positive/negative zero crossings to determine if the most recent sample represents a heart beat. Given this information, we mark the timestamp of the current heartbeat, and then look at the interval between this beat and the former beat, calculating a delta. This period is then converted into a frequency (in beats per minute), and thresholded against known “usual” heart rates. This simple filter helps to remove extraneous noise, like missing a beat (very low heart rate). This value is then added to an array, which is used to average over the last 4 BPM values to output the average heart rate. This average heart rate is the value used to calculate vibrations.
To calculate Heart Rate Variability (HRV), we want to look at the changes in timing between successive heartbeats. From the heart rate measurement above, we calculate the interval between heartbeats, we can simply save this value, and on the next heartbeat, look at the difference between these two intervals. We again need to do some thresholding, as missing beats will have a very large HRV. We use a pseudo-Root Mean Squared of Successive Differences (RMSSD) to analyze this data, which is done by taking an array of the last 10 inter-interval changes, squaring each, summing them, normalizing by the number of samples, and finally square rooting this value.
ONe limitation of our HRV algorithm is the short timespan. HRV is usually calculated over a period of at least 3-5 minute, but we use 10 values, approximately 10-15 seconds. This gives us a faster response value, and for our experiments, we calculated HRV using the entire 5 minute sections, but it is not incredibly reliable. Additionally, HRV is measured somewhat like the derivative of heart rate, which here is measured like the derivative of heart beat times. Because this value approximates a second derivative, it is much more susceptible to noise. Along those same lines, HRV is mainly useful when the heart rate is stable, since looking at the changing intervals between heartbeats when the heart rate is changing is less meaningful as a measure of physiological stress.
Vibration Control
The vibration control module is responsible for receiving commands (e.g. "send a heartbeat vibration at 60 BPM") from the main module and outputting this vibration to the motors. Because the program will be running other functions during vibration, such as reading from the MAX30102 sensor, it is important that the vibration control module was non-blocking. To achieve this, we used timers and a simple state machine shown in Figure A3. This created a waveform that could be output to the motors via PWM but without blocking the main program from executing.
Keyboard User Interface
We added the ability to modulate the perceived heartbeat by allowing the rate of output vibrations to be scaled by a positive, nonzero value. Keyboard input response was enabled to increase or decrease a stored scaler value — the heart rate generated by the vibration module is set to the user’s current heart rate multiplied by this scaler. The scaler is initialized to 1.0, such that by default, the user perceives a heart rate that matches their own. The scaler resolution was set to 0.05, meaning that heartbeat feedback can be modulated by a minimum of 5%. To keep the product development cycle as agile as possible, we used a tethered computer/laptop for power and simple user input. We needed at least three commands: 1) increase feedback ratio, 2) decrease feedback ratio, and 3) reset ratio to 1 (for a new trial). In keeping with this theme, we used the “+/=” key to increase the scaler by 0.05, “-” key to decrease by 0.05, and “0” to reset the scaler to 1.
Enclosure
The enclosure CAD model is shown below in Figure 1, and the printed version is shown in Figure A5. It was designed in Fusion 360 and 3D printed. The device can be held in the users hand, or can be strapped to a user's wrist or arm using the velcro strapping points. The MAX30102 sensor snaps into the lid, and the lid snaps into the enclosure body. The motors are glued into the base of the body. .
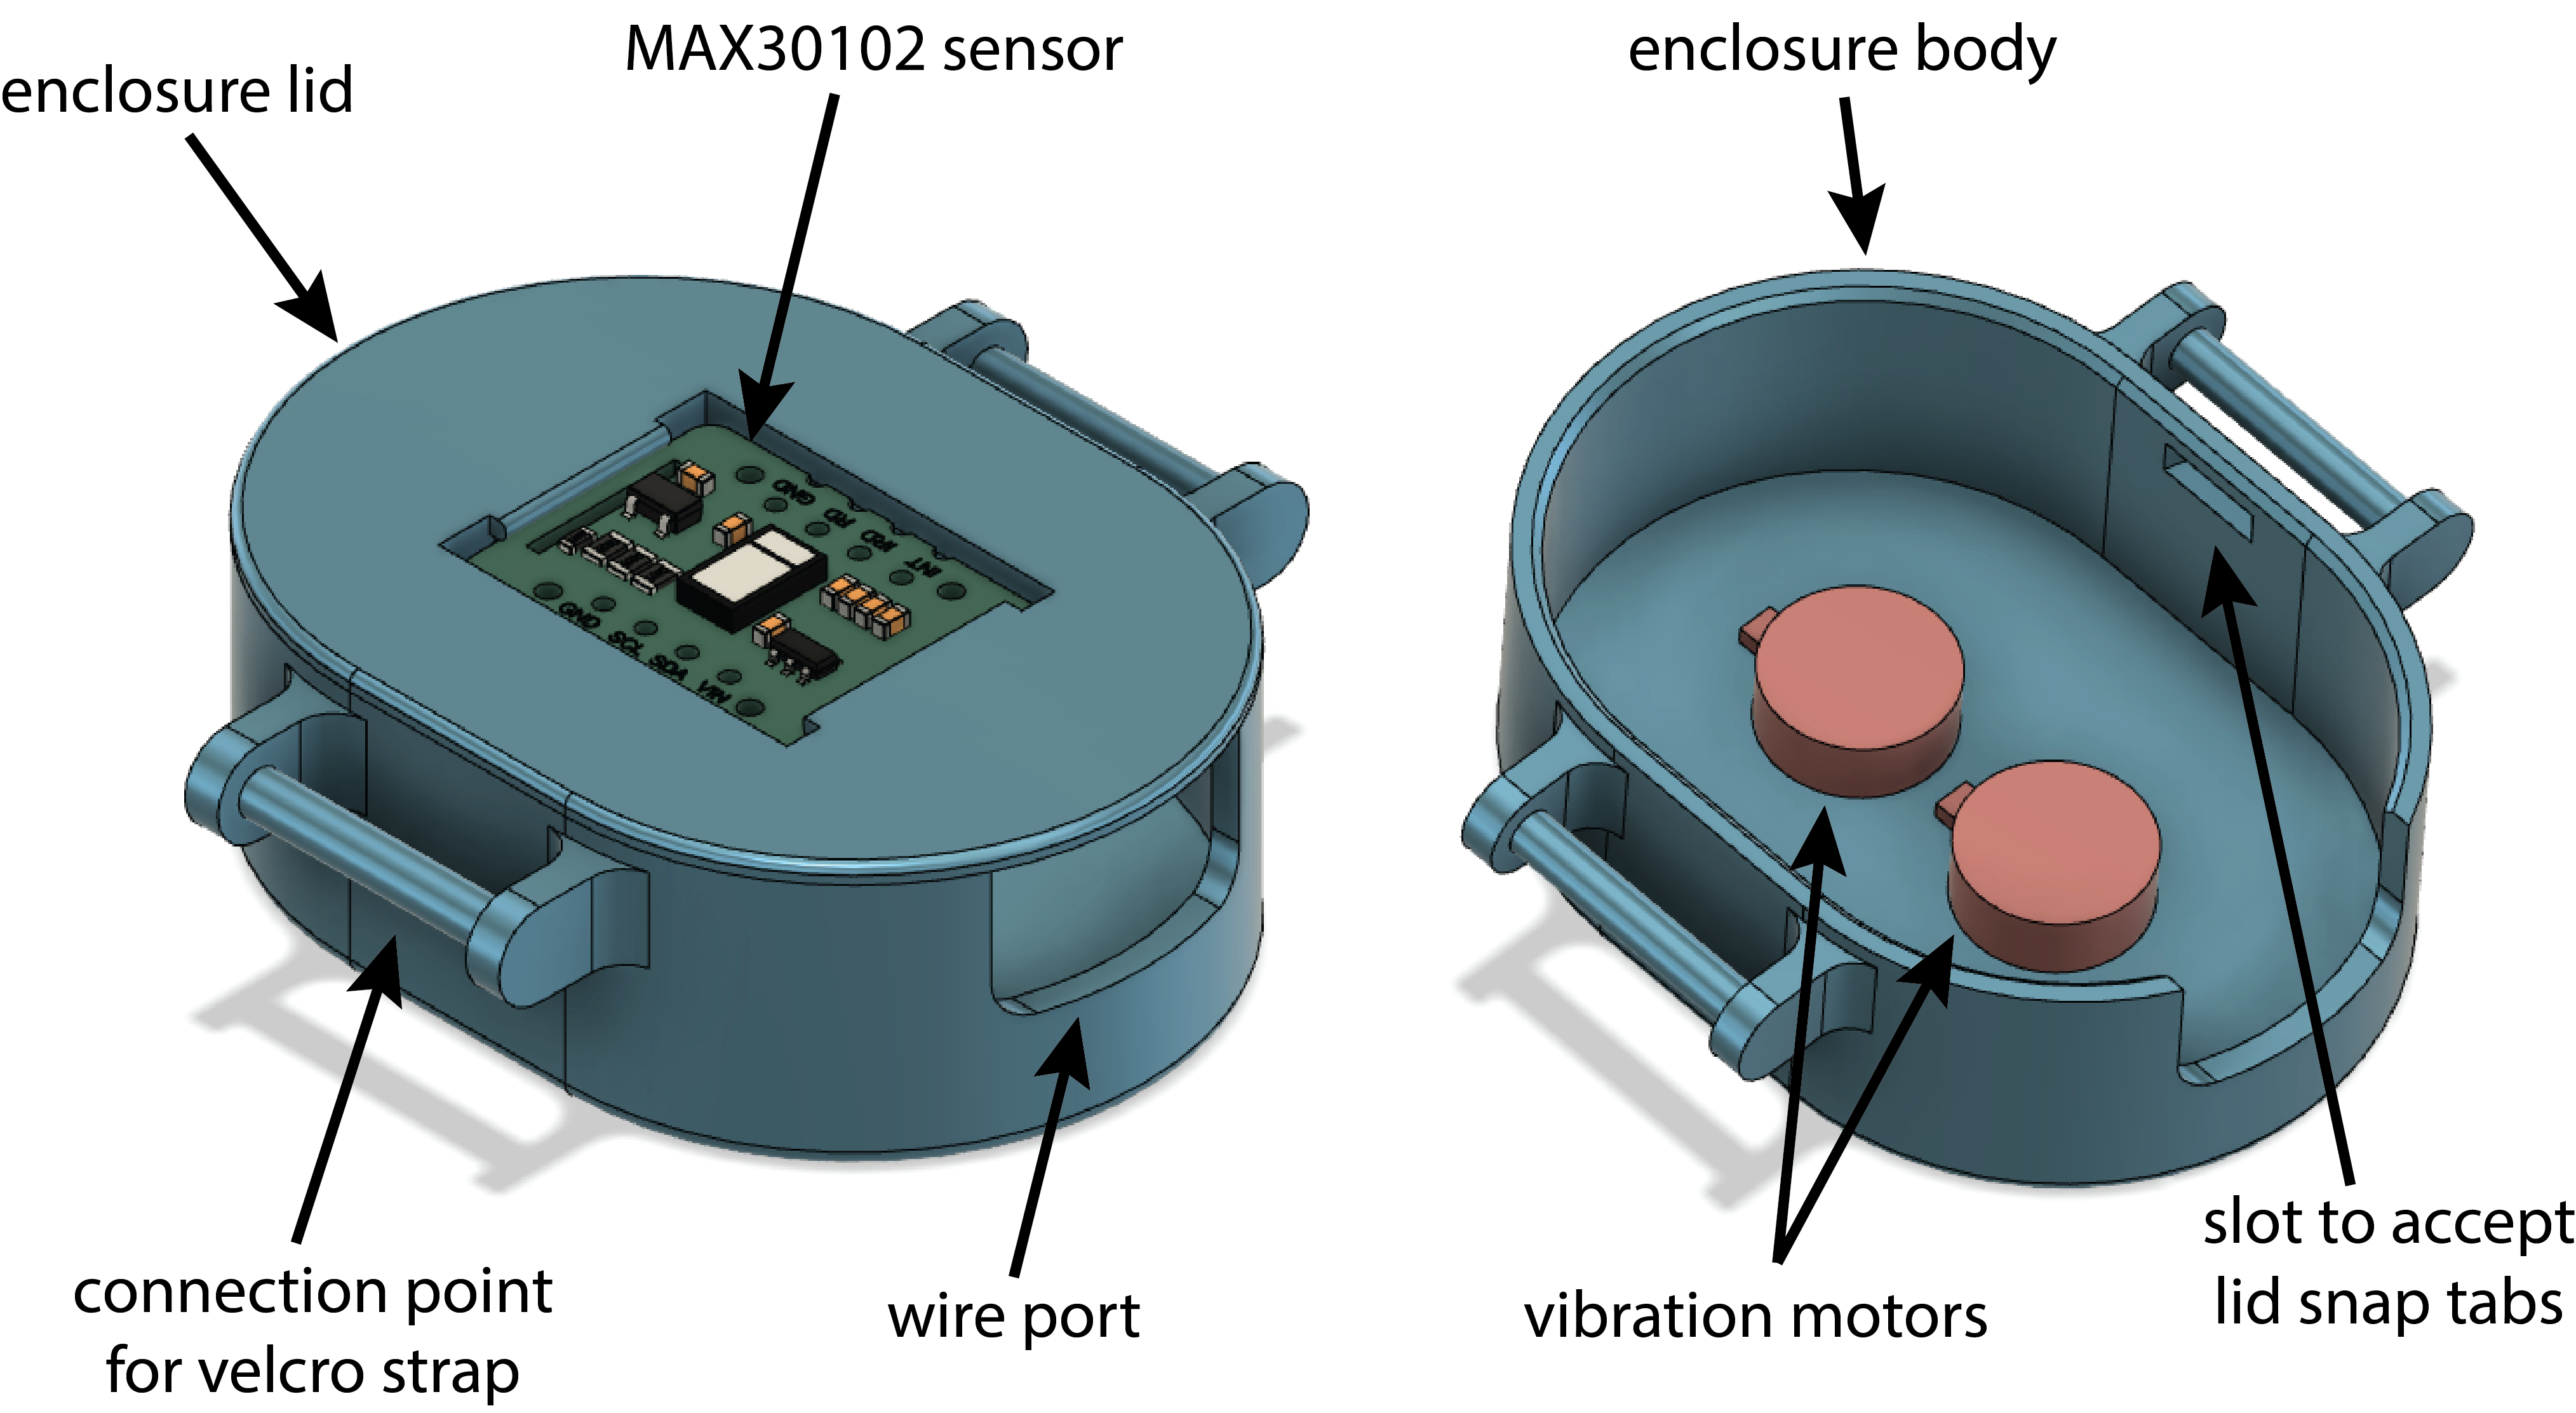
Figure 1. CAD model of the HeartBeet enclosure.
System analysis and control
To analyze our system, and to best understand the frequencies at which we could apply heartbeats, we conducted an experiment that would help us understand the vibration frequency versus vibration perceptibility of our specific system. This would allow us to create a bode-like plot that compared vibration motor command frequency with minimum amplitude required for perception. We were specifically interested in the upper-end of vibration frequencies we could encode - from our pilot testing with the system we designed for our paper demonstration, we found that at high frequencies, the heartbeat became muddled and difficult to perceive. We hypothesized that the plot would be flat at low frequencies, but would slope upwards at higher frequencies.
Two of the devices' designers completed this experiment. The experiment involved testing the perceptibility of 16 different frequencies ranging from 1 to 100 Hz (frequencies ramped up logarithmically). The vibration motors were being commanded in a square-wave fashion at 50% duty cycle. At each frequency, the experimenter slowly ramped the vibration motor command amplitude up by 2% steps until the participant reported being able to feel the vibrations. Participants both listened to loud music during the experiment to prevent them from subconsciously perceiving the vibration motor sounds instead of vibrations. P1 used a cloth above and below their hand to dampen the vibrations; P2 did not use cloth.
Results of this experiment are shown below in Figure 2. We found that, at low frequencies, users needed a lower amplitude to detect the vibration. As frequency increased, the amplitude required to detect the vibration increased, and then leveled off. This is likely because of the electromechanical properties of the motor - at high frequencies, the motor is not truly outputting a square wave any more, rather, it is likely just outputting a sustained vibration.
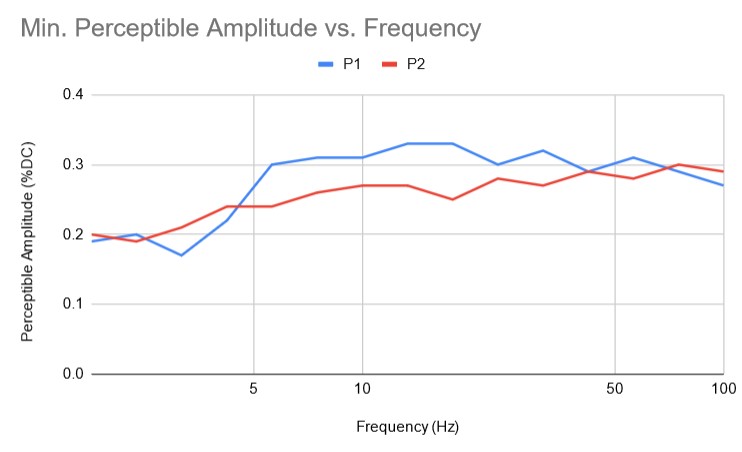
Figure 2. Results from the minimum perceptible amplitude versus frequency experiment.
Demonstration / application
The device usage is very simple, a finger is placed on the exposed sensor with steady pressure. The heart rate is analyzed (the HR buffer array is filled), and when a stable heart rate is detected, vibration feedback begins. As the user’s heart rate changes, the vibration feedback will accelerando or decelerando in kind.
To change the vibration feedback ratio, keyboard commands can be used, increasing or decreasing the measured heart rate to vibration heart rate by 5%. The ratio can also be reset to 1 for a new participant. The vibration feedback is bounded by the realistic sensation limits of the vibration algorithm, 40-120 BPM, so a feedback ratio that pushes the commanded heart rate outside that limit will not be displayed.
During operation, both the measured and commanded (vibration feedback) heart rates are displayed via terminal. The rolling RMSSD of the last 10 measurements is also displayed. These values are updated at the start of each new commanded heart rate.
Experimental Data Logging
During experiments, it is important to collect as much data as possible. So a “data logging” mode can be enabled which turns off the averaging, and displays the most recent heart rate and heart rate variability data. This is written to the terminal in a comma separated format, to be easily copy-and-pasted into a .csv file for analysis. An SD card based logger was partially implemented, but due to hardware limitations of the Arduino, was not used for the sake of time.
Data logging mode does not change the functionality of standard terminal commands (changing feedback ratio), and can be turned on with `TERM_LOGGING` in HeartRateSensor.cpp`.
Results
Experiment 1 - Effect of Vibratory Feedback on Resting HR and HRV
Our primary goal with this device was to test its ability to promote relaxation in participants, and to assess how a modified HR feedback could influence this. We conducted this test with two participants. For the test, participants completed four 5-minute tests, holding the device throughout the entirety of each test. These tests were: (1) no vibratory feedback, (2) feedback based on the user's true HR, (3) feedback 20% faster than the user's HR, and (4) feedback 20% slower than the user's HR. During each test, HR and HRV quantities were logged for every heartbeat. Following the test, data were processed and visualized in Python 3.6. Processing involved removing datapoints that were obviously incorrect - this includes when heart rate was below 40 BPM and HRV was above 200 ms.
Results are shown in Figure 3, panels A and B. For participant BY, it seemed that the true and slowed HR feedback was moderately stressful (reflected by decrease in HRV) relative to no feedback, and fast HR feedback was quite stressful. Participant JD had a different reaction to feedback - they had minimal changes in HRV in the true HR and slow HR feedback, and surprisingly, their HRV indicated they were more relaxed during the fast HR trial. These findings indicate that more work (especially a larger sample size) is needed to condidently determine the effect of this device.
Experiment 2 - Effect of Vibratory Feedback on HR Recovery Following Exercise
A secondary goal of ours was to assess how this device could potentially be used to influence human performance. Specifically, we sought to understand how this device could be used to help the body more rapidly return to a resting state following exercise. We conducted a single test with two conditions with two participants. For both conditions, each participant completed approximately 1 minute of exercise (jumping jacks or climbing stairs). Then, the participant rested in a chair for 3 minutes while the HeartBeet measured their heart rate. For one condition, the HeartBeet had vibratory feedback turned on, and for the other, the device only measured HR and did not provide any feedback.
Second-by-second HR values for the two participants are shown in Figure XX, panel C. This test exhibited one shortcoming of our devices current configuration - there is likely an issue either with the off-the-shelf peak detection algorithm that arises during high HR conditions, as these conditions have less forgiving signals and require the algorithm to be more precise. Thus, our results for this trial are difficult to interpret, especially BY no feedback (red) and JD feedback (purple) because they don't have data during the first 25 seconds. With a larger sample size and improvements in the peak detection algorithm, there is a possibility exponential decay curves could be fit to these data, and the time constants of these curves could be compared. If the time constant of the conditions with feedback were smaller, this would indicate the HeartBeet is a useful device for accelerating post-exercise recovery.
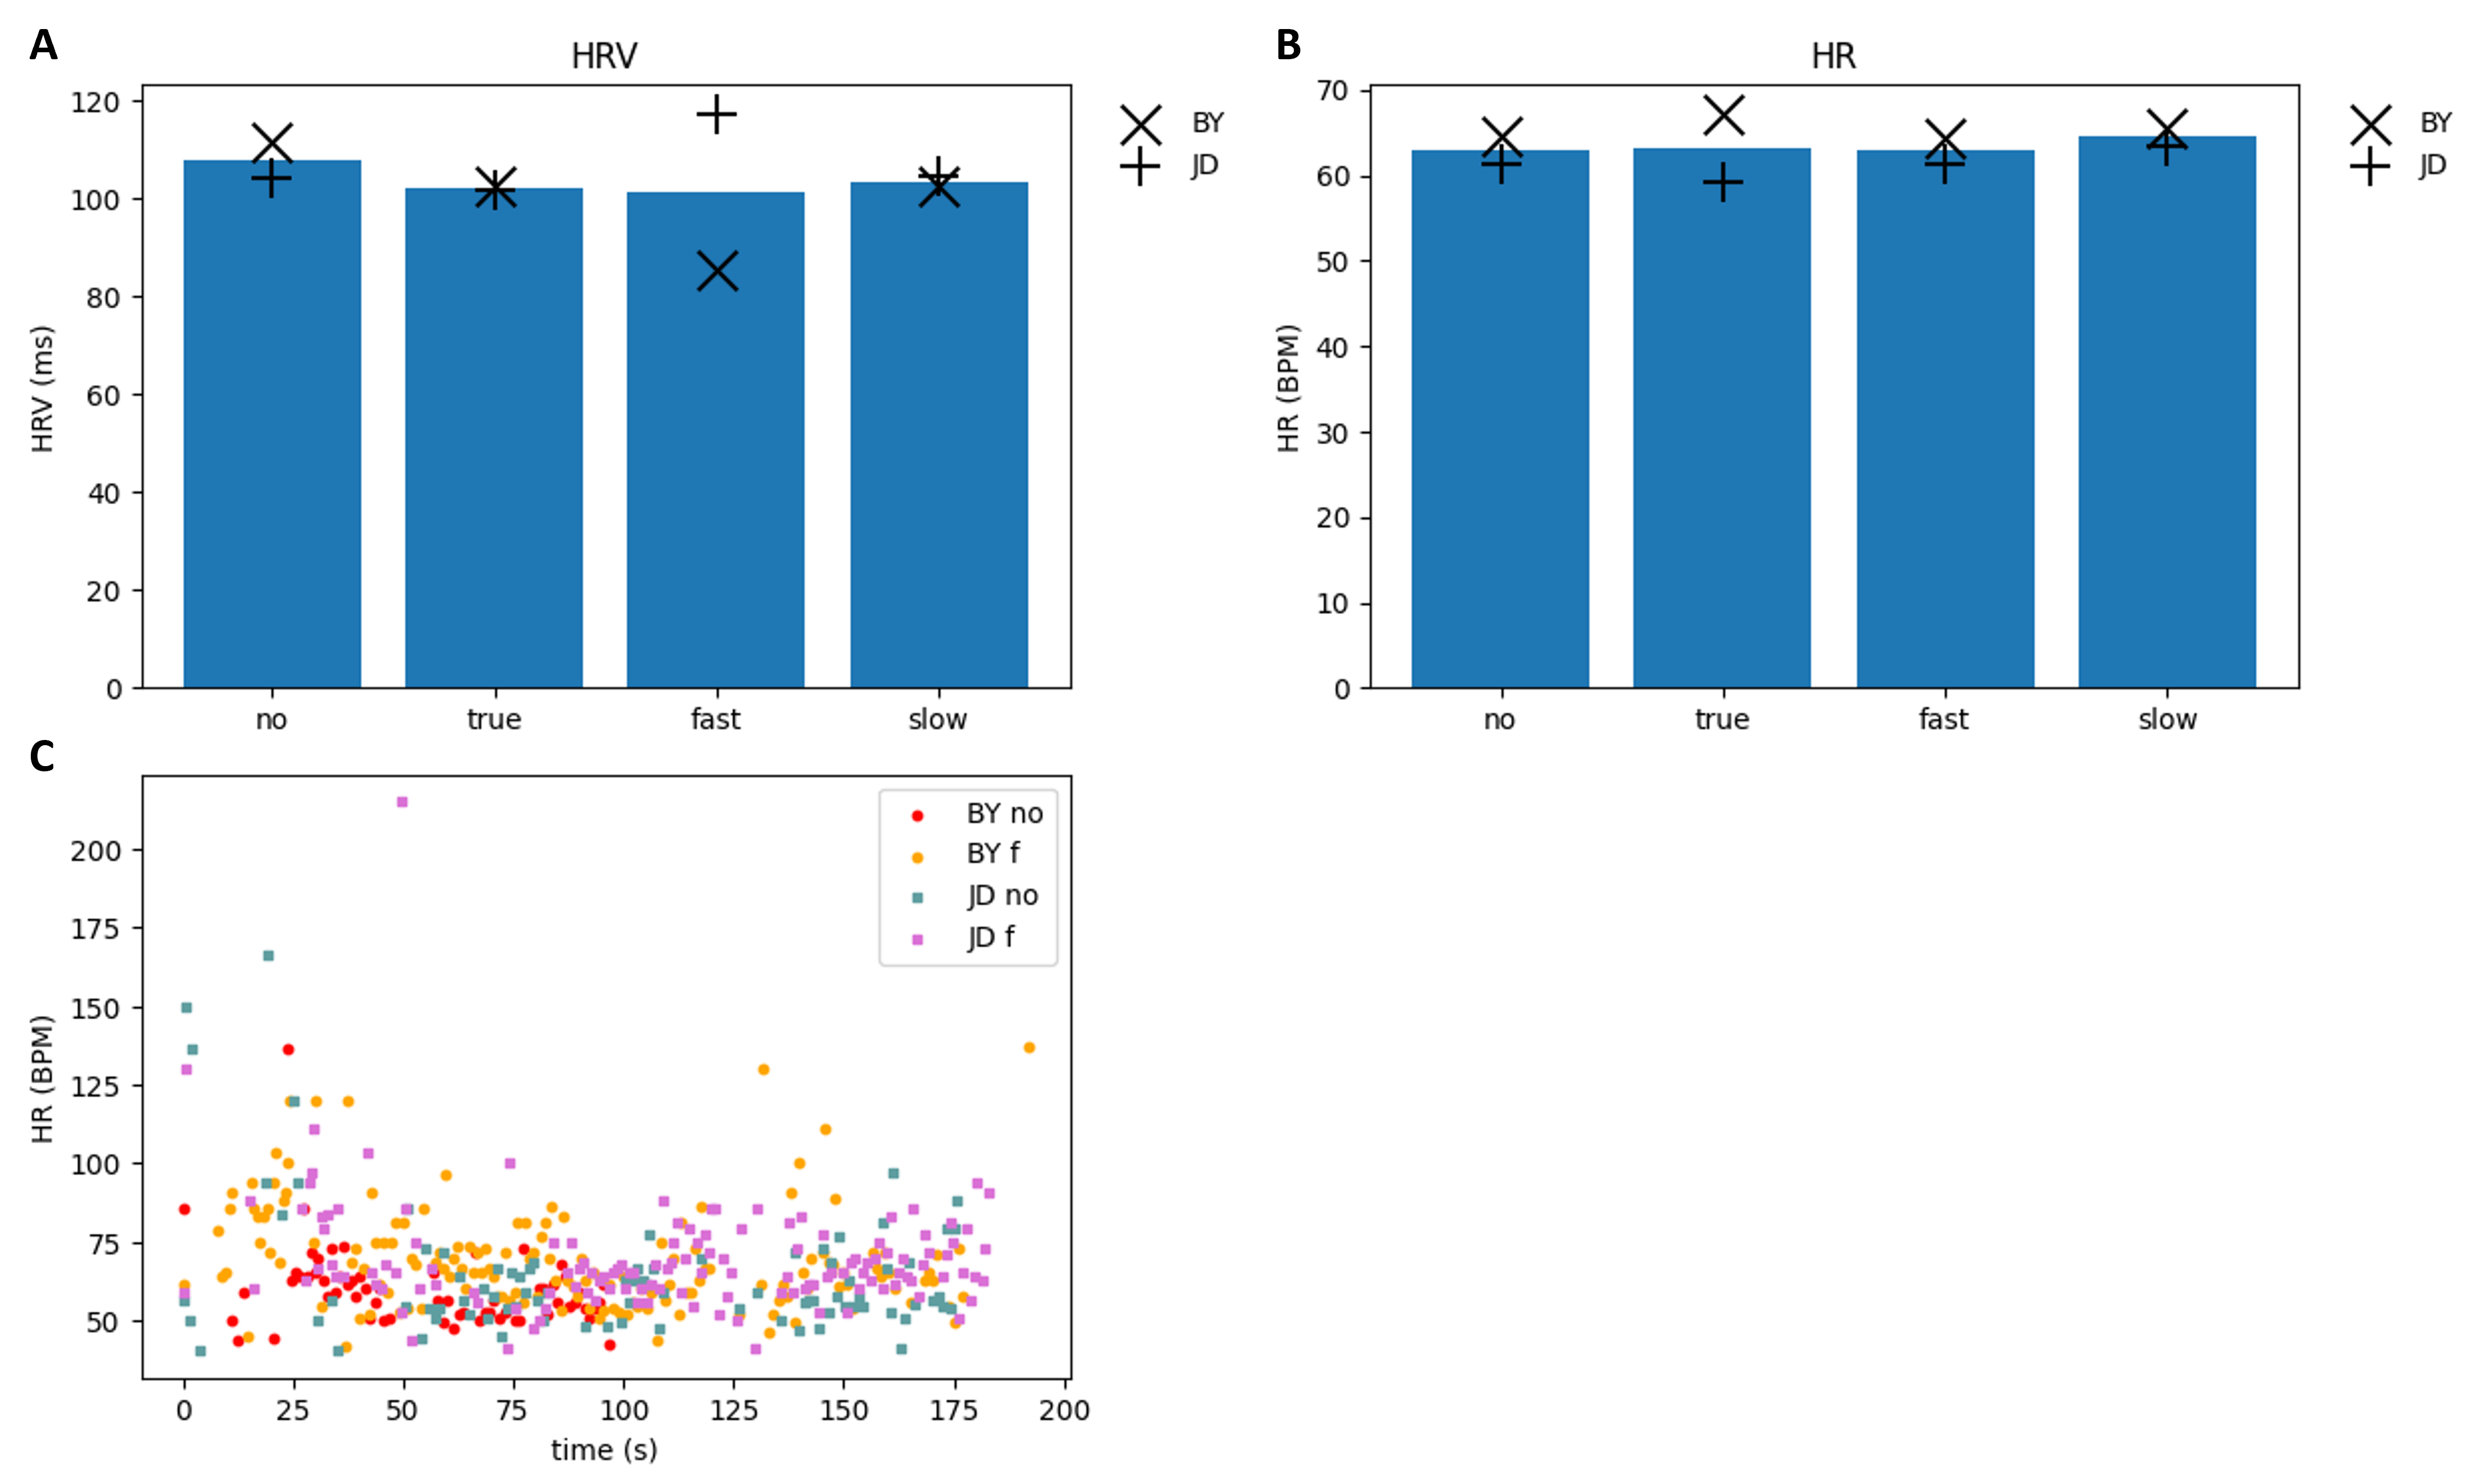
Figure 3. Results from experiments. Panel A shows HRV results for two subjects from Experiment 1, bars indicate mean value. Panel B shows mean heart rate from each condition in Experiment 1. Panel C shows the HR decay over time following the conclusion of exercise (at time = 0 sec). For all panels, no = no feedback, true and f = true HR feedback, fast = HR feedback 20% faster than measured HR, slow = HR feedback 20% slower than measured HR.
Future Work
Our experiments show that there is a possibility of a correlation between perceiving a faster than your own heart rate and physiological stress, our small sample size (and conflicting data points) make the link difficult to define. A future direction of experimentation would be to increase the sample size, and trying to isolate other confounding variables (too intimate knowledge of the expected outcome, seeing the numerical value of heart rate during the trial).
Another avenue of exploration is to improve the sensor reliability. For our exercise trials, the peak detection algorithm was not very good at detecting very fast heart rates, and took too long to get a stable reading, making it difficult to look at the influence of haptic feedback during cool downs. Increasing the robustness of the optical heart rate detection algorithm would improve both the feedback and data collection aspects.
A commercial application would be adapting the HeartBeet from a standalone microcontroller based project to an app on a smartwatch or other existing wearable device. As the Zhou paper stands, 1:1 heart rate feedback could be used in meditation or other relaxation focused activities, and further experiments could show the viability of increased or decreased feedback ratios.
Files
Team Photo on Demo Day
References
Azevedo, R., Bennett, N., Bilicki, A., Hooper, J., Markopoulou, F., & Tsakiris, M. (2017). The calming effect of a new wearable device during the anticipation of public speech. Scientific reports, 7(1), 1-7. https://doi.org/10.1038/s41598-017-02274-2 Savage, P. E., Brown, S., Sakai, E., & Currie, T. E. (2015). Statistical universals reveal the structures and functions of human music. Proceedings of the National Academy of Sciences of the United States of America, 112(29), 8987–8992. https://doi.org/10.1073/pnas.1414495112
Takeya, R., Kameda, M., Patel, A. D., & Tanaka, M. (2017). Predictive and tempo-flexible synchronization to a visual metronome in monkeys. Scientific reports, 7(1), 6127. https://doi.org/10.1038/s41598-017-06417-3
Yoon, H., Choi, S. H., Kim, S. K., Kwon, H. B., Oh, S. M., Choi, J.-W., Lee, Y. J., Jeong, D.-U., & Park, K. S. (2019). Human heart rhythms synchronize while co-sleeping. Frontiers in Physiology, 10. https://doi.org/10.3389/fphys.2019.00190
Zhou, Y., Murata, A., & Watanabe, J. (2020, March). The calming effect of heartbeat vibration. In 2020 IEEE Haptics Symposium (HAPTICS) (pp. 677-683). IEEE. https://doi.org/10.1109/HAPTICS45997.2020.ras.HAP20.157.5a2e1551
Appendix: Project Checkpoints
Checkpoint 1
Here you will write a few paragraphs about what you accomplished in the project so far. Include the checkpoint goals and describe which goals were met (and how), which were not (what were the challenges?), and any change of plans for the project based on what you learned. Include images and/or drawings where appropriate, using a command like this:
Goals
- Acquire all hardware components (SPO2 sensor)
- Clean up raw absorbance sensor output using exponential filter
- Make a plan for device's physical implementation
Methods
We ordered an off-the-shelf heart rate/SPO2 sensor from Maxim Integrated (MAX30102) and imported the associated Arduino library. We started a Github repository so we can all contribute to the software that will control the device. We decided we don't need to filter the IR data because the signal looks smooth, however we will need to design an algorithm to calculate heart rate variability (a physiological measurement than can be used to estimate stress). We brainstormed for chassis ideas for the device, which mostly involved choosing how device will sit on the user (Figure A1).
One challenge we've run into so far is the Arduino randomly stopping transmission back to the computer. We suspect this is because of some faulty jumper wires that connect the SCL, SDA, Vin, and GND on the MAX30102 to the Arduino. Our plan to address this problem is to make our wiring more robust by using Dupont connectors instead of jumper wires.
We conducted a short test to validate our calculated heart rate using the absorbance sensor (Figure A2). We found that the heart rate our device reported was accurate within approximately +/- 2 BPM when compared to the Apple watch. This is an acceptable error, given that the Apple watch likely averages over a number of heartbeats, and our device currently only reports the BPM based on the last beat time.
Discussion
Next, we will:
- CAD model and 3D print our device chassis so that everything can be worn and wires are enclosed
- Integrate vibration motors so the user can feel their own heartbeat, or a modified heartbeat based on their own heartbeat
Images
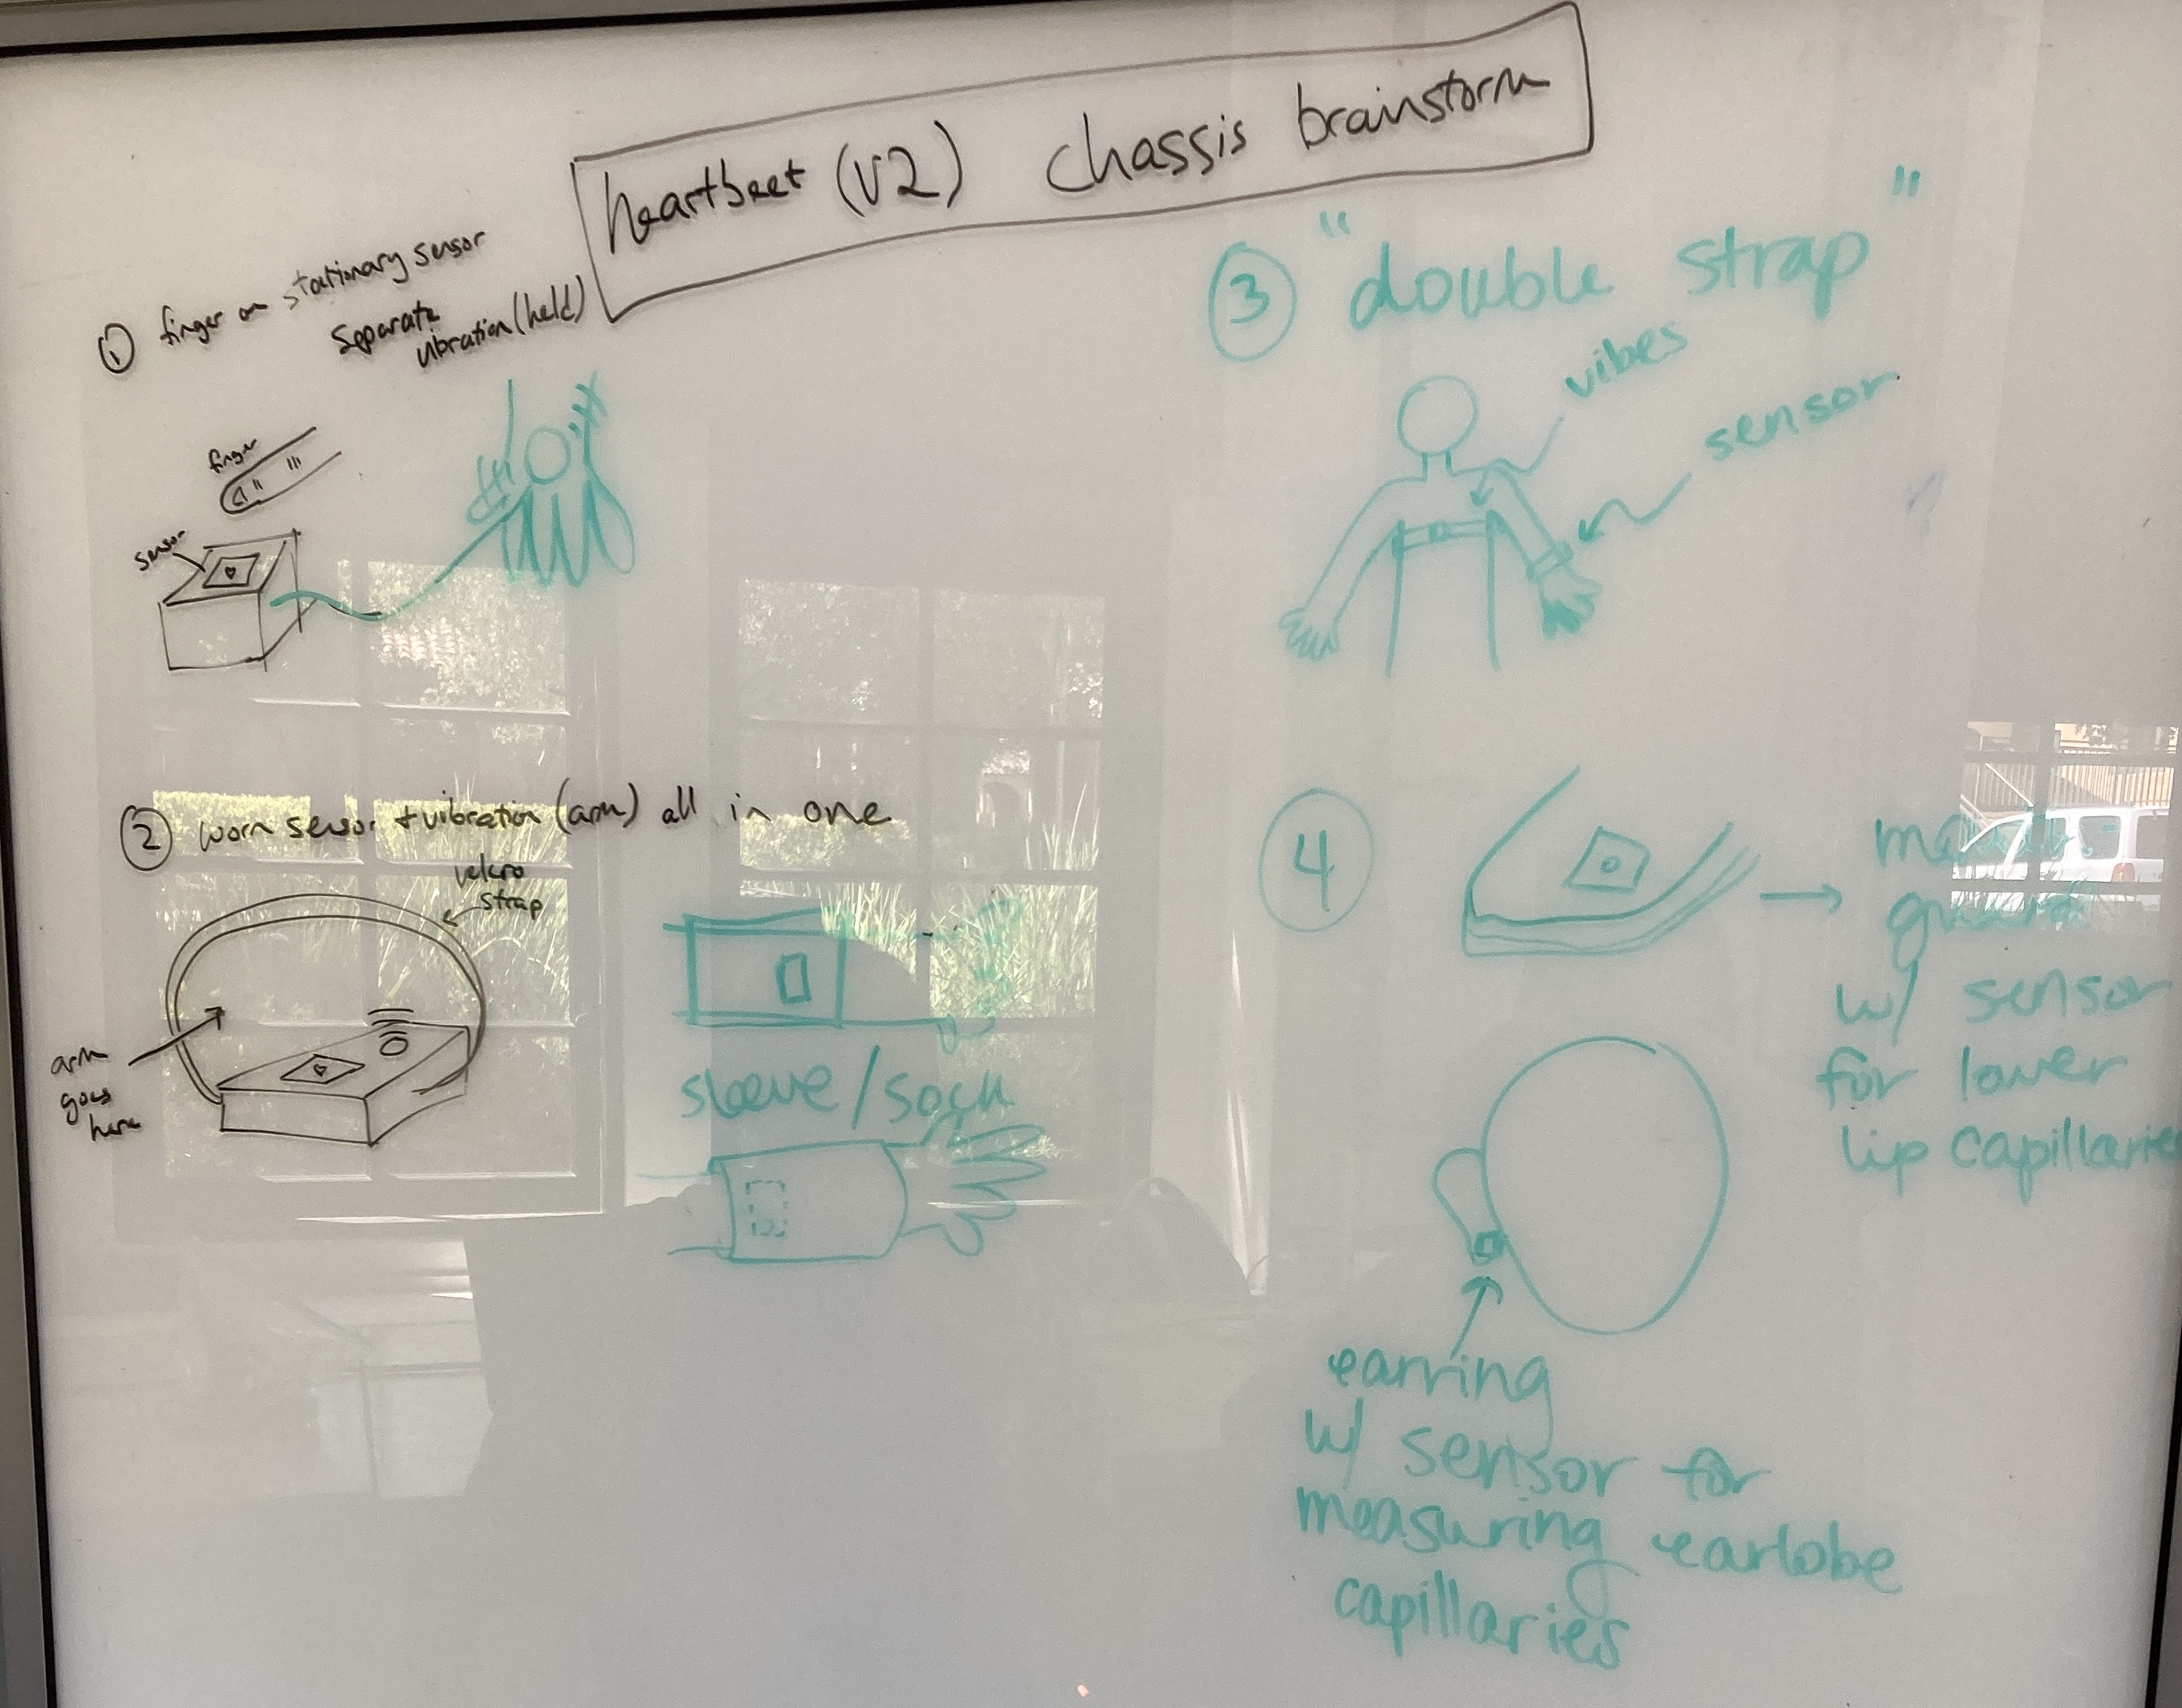
Figure A1. Whiteboard brainstorm session on physical housing of the device
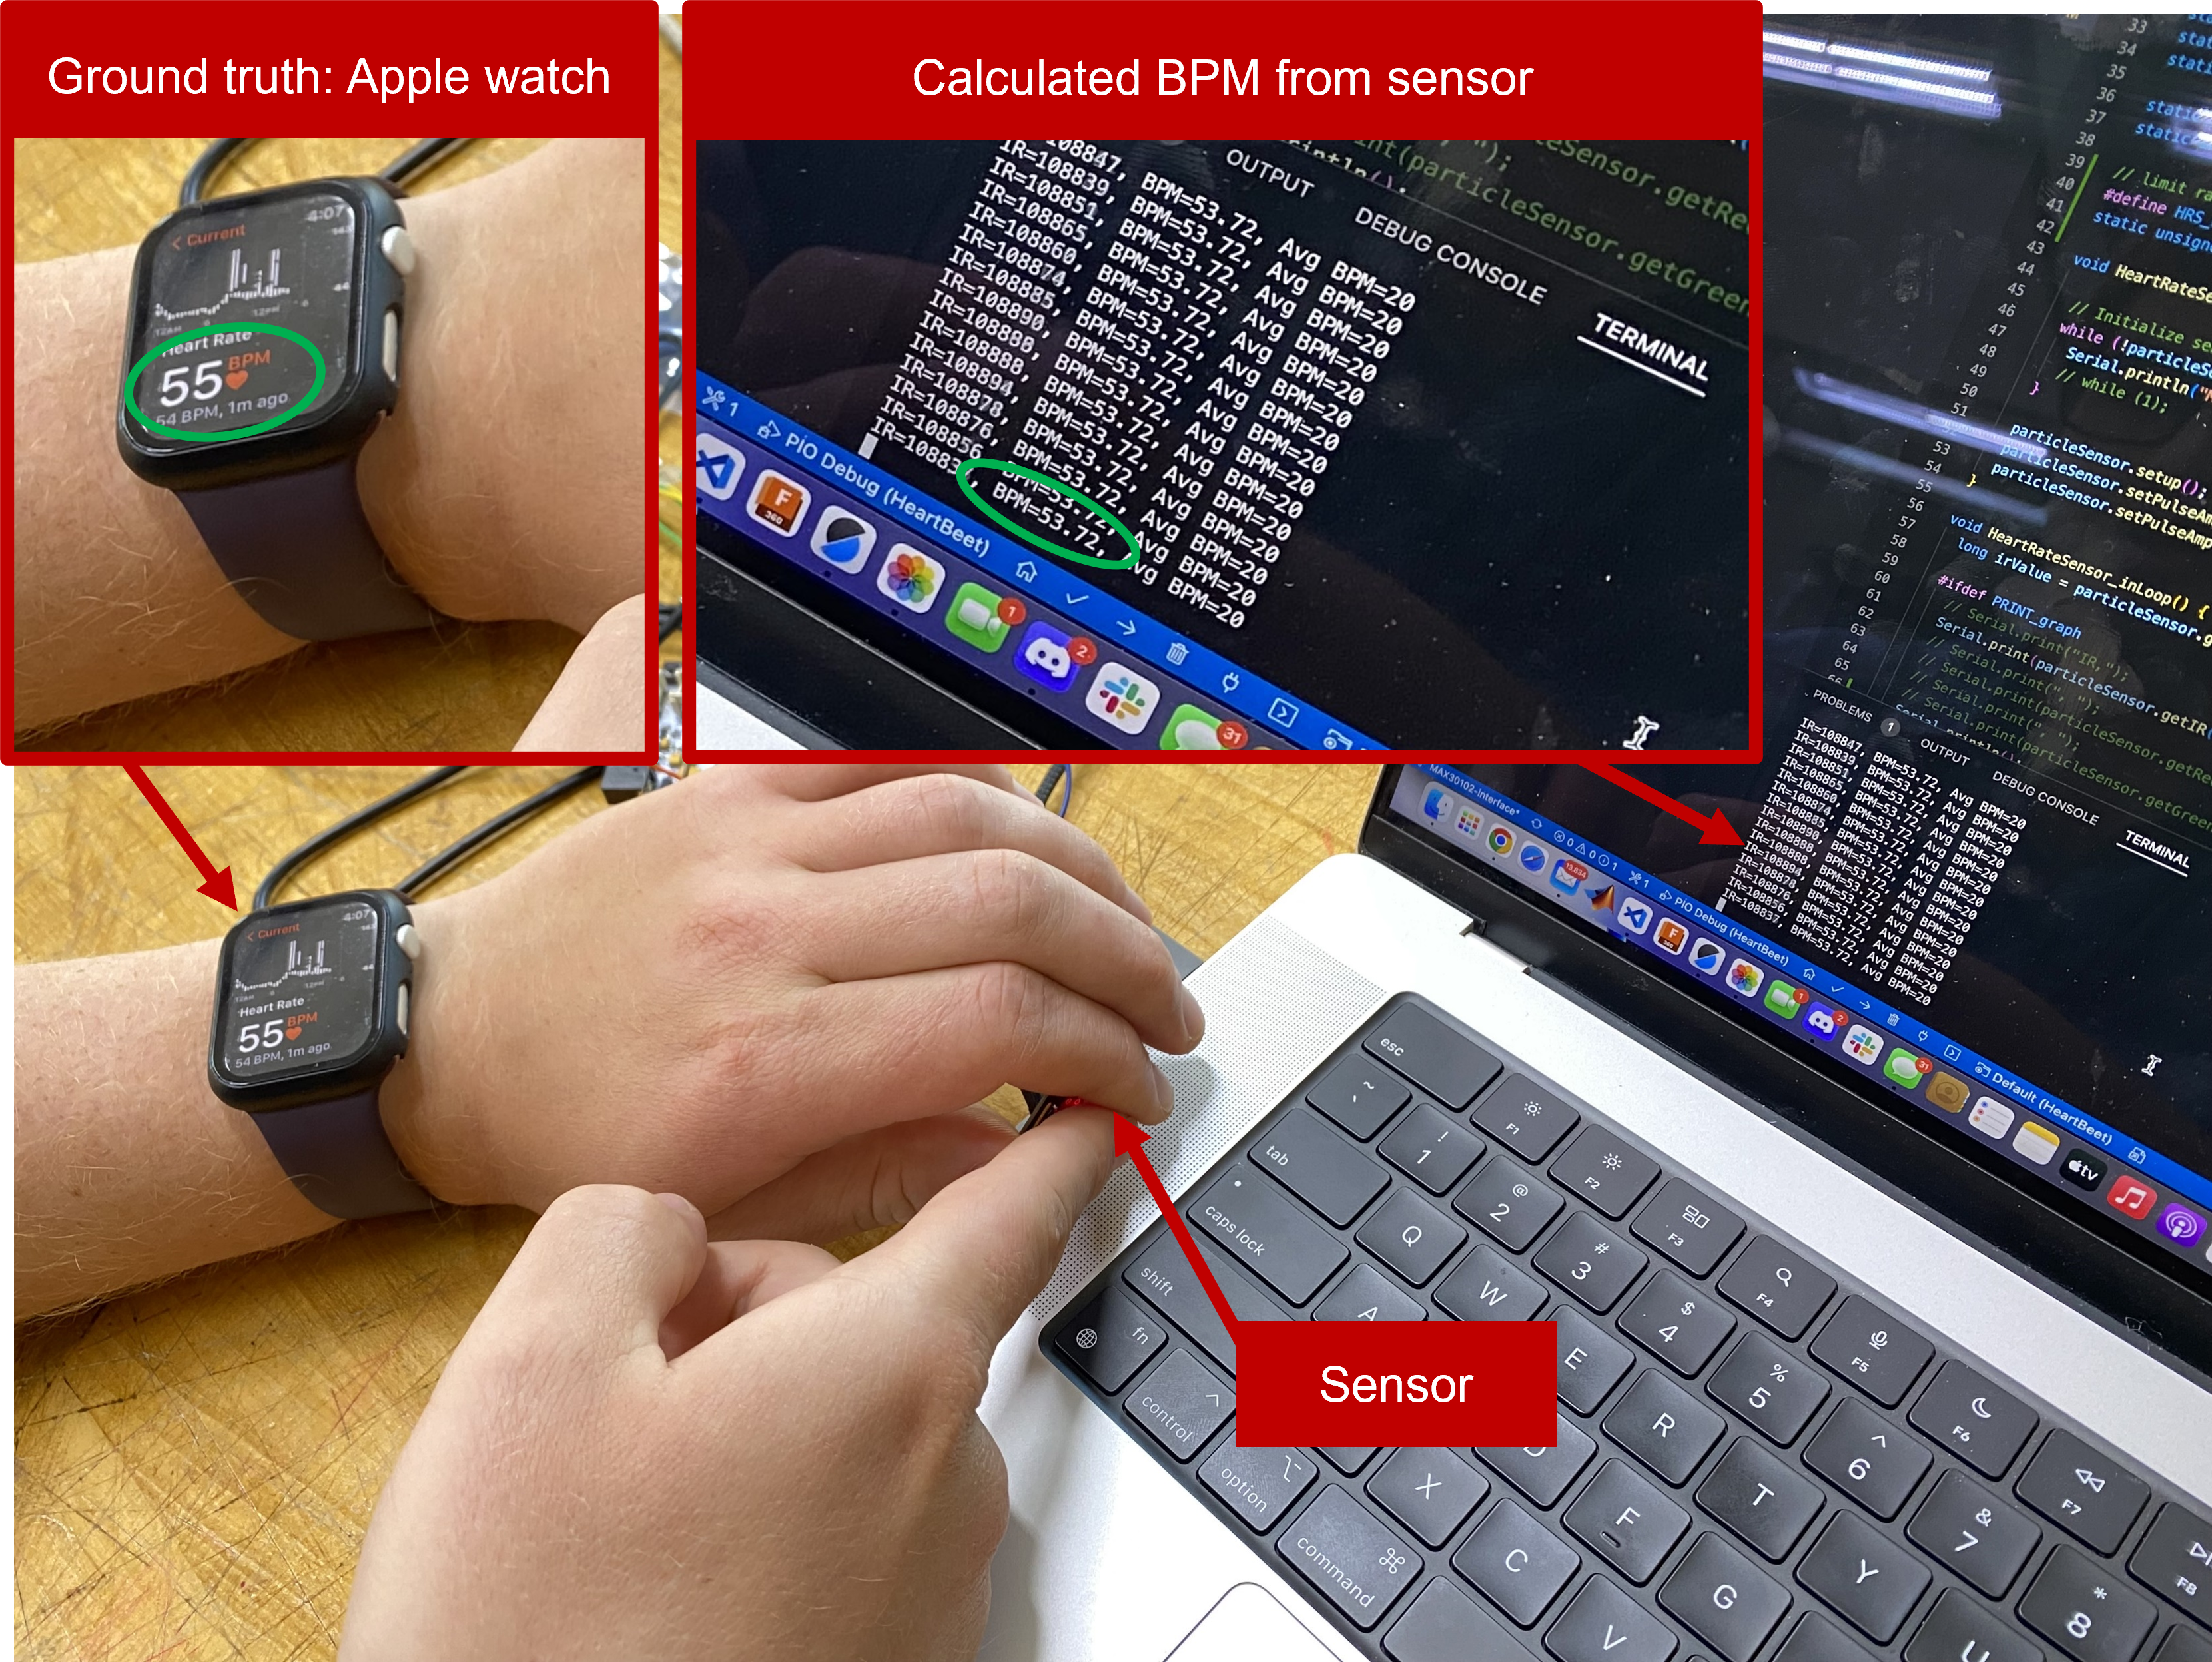
Figure A2. Image from a test seeking to validate our calculated heart rate using an apple watch heart rate measurement. The "BPM" column in the serial monitor nearly matches the BPM reported by the Apple watch. The "Avg BPM" column in the serial monitor was not set up correctly, and should be ignored.
Checkpoint 2
Goals
- Implement a module to control the vibration motors that is non-blocking (uses timers)
- Design an enclosure for the sensing and actuation part of the system so that our device is easier to interact with
- Implement method to modulate actuated heartbeat to be faster or slower than the measured heart rate
- Integrate and test HRV sensing
- Analyze effect of vibration motor on/off frequency on user's ability to perceive vibrations
Methods
Vibration module. We wrote code to control the vibration motors so that we could have the device's user feel a "heart beat" that was created by the vibration motors. While the end effect is the same, this code needed to be more complex than our demonstration from a few weeks ago during our paper demonstration. This time, the vibration motor code needs to be non-blocking - in other words, we can't use delay() to time out the vibrations, and we also cannot assume each pass through loop() will take the same time, as we have other modules that may be doing things too (e.g. the heartbeat sensing module). Thus, we chose to use the arduino-timer library and a simple state machine that tracks the point in the heartbeat cycle we're in. This state diagram is shown below in Figure A3.
Enclosure. We designed and 3D printed an enclosure to house the MAX30102 sensor and two vibration motors (CAD in Figure A4, Test fit in Figure A5). This was done to make the device more aesthetically pleasing, and also easier to use (holding the vibration motors and sensors individually was tricky). The vibration motors snap into the inside of the base of the enclosure, and the MAX30102 sensor snaps into the "lid" of the enclosure. Then the lid snaps onto the base. One challenge we ran into with this effort was balancing robustness with flexibility on the snap-together parts - they needed to be strong enough not to snap, but flexible enough to bend during the fitting process. Thus, it took us a few iterations until we were satisfied with this part of the project.
Modulating actuated heartbeat. We added the ability to modulate the perceived heartbeat by allowing the rate of output vibrations to be scaled by a positive, nonzero value. Keyboard input response was enabled to increase or decrease a stored scaler value — the heart rate generated by the vibration module is set to the user’s current heart rate multiplied by this scaler. The scaler is initialized to 1.0, such that by default, the user perceives a heart rate that matches their own.
HRV integration. The Root Mean Squared of Successive Differences (RMSSD) was one of the key quantitative metrics in the Zhou paper, and we sought to investigate similar data. Because we had a relatively robust peak detection algorithm, we used the timing of these heart beats to generate the “successive differences” of RMSSD. While the standard time to calculate RMSSD is several minutes, we calculate an approximate value over a period of 10-30 heartbeats. While not as theoretically accurate as an EKG derived value, our measurements were consistent with the typical values for people our age, and agreed with the Apple Watch generated HRV values for all three members of our team.
Minimum perceptible amplitude vs. frequency We sought to analyze the dynamics of our system by conducting bode-like analysis on our system. Specifically, we wanted to understand how vibration motor on/off frequency affects the users ability to perceive such vibrations. This was important because we needed to determine a max heart rate to actuate in our project - beyond such a rate, the user would likely not be able to perceive the vibrations. This experiment involved sending a 50% duty cycle square wave to the motors (inside the enclosure) at a range of frequencies, starting at 1 Hz. For each frequency, the experimenter started the vibration amplitude at 0%, and increased the amplitude by 5% increments until the participant was able to discern the vibration. We hypothesized that low- and mid-range frequencies would have similar minimum perceptible amplitudes, and higher frequencies would cause the minimum perceptible amplitude to increase. We have collected data for two participants and will include our results in our final report.
Discussion
Next, we will:
- Analyze our data from the vibration frequency vs amplitude experiment
- Conduct an experiment to see if our device can successfully modify a person's HRV
Images
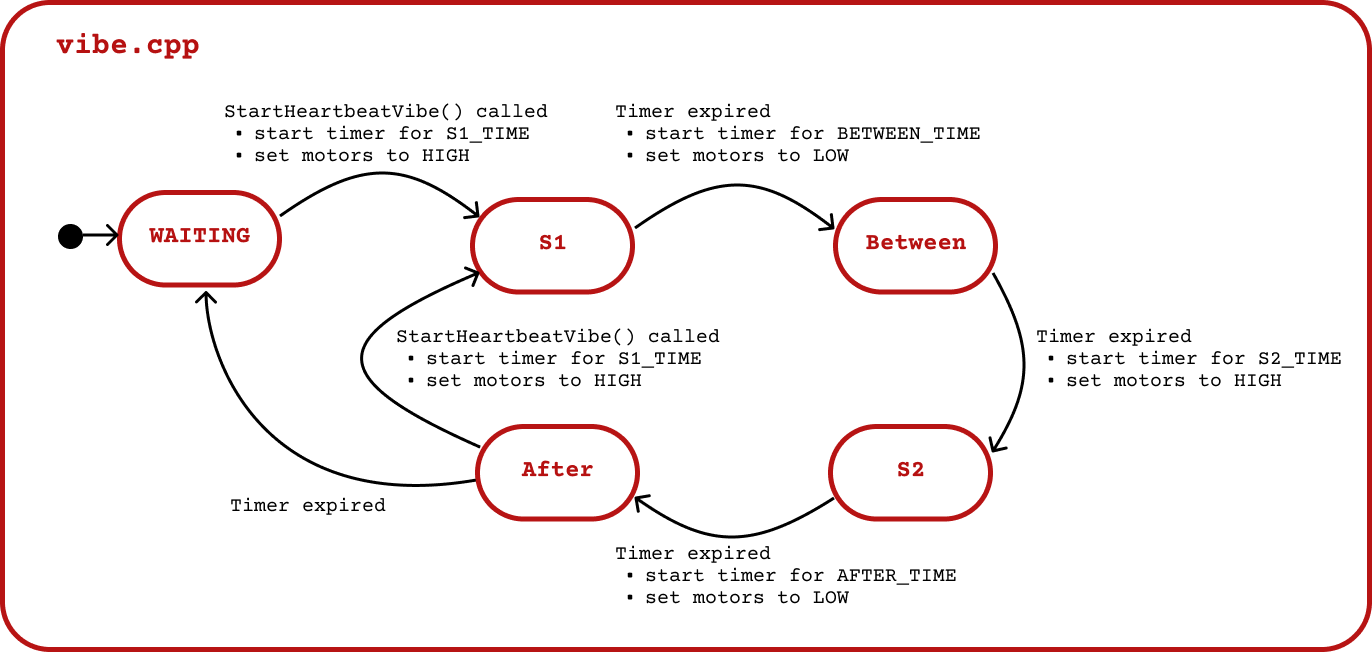
Figure A3. State chart diagram demonstrating how the vibe module moves through different states depending on different timings that specify the heartbeat shape.
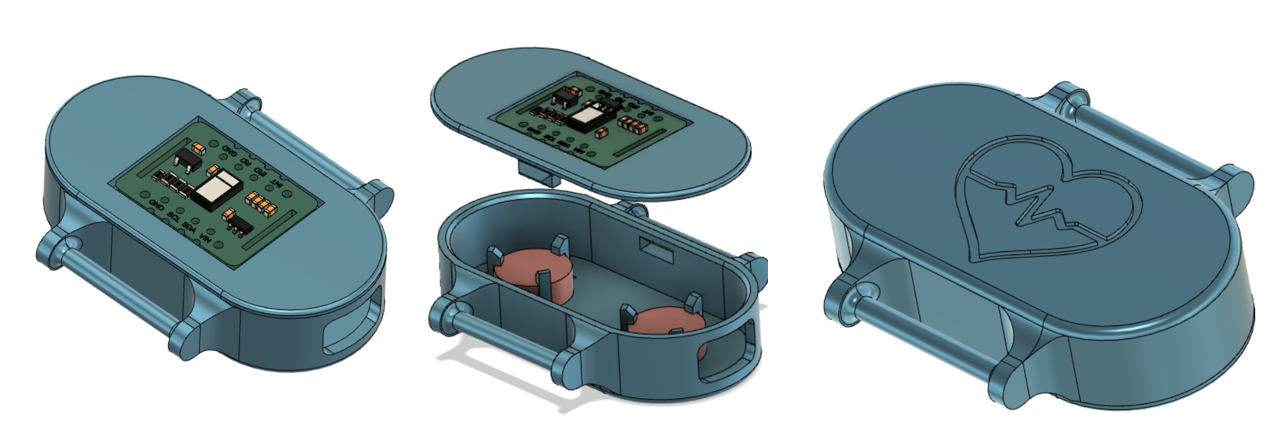
Figure A4. An early version of the enclosure. 3D printed components are blue, vibration motors are red, and the MAX30102 chip is green.
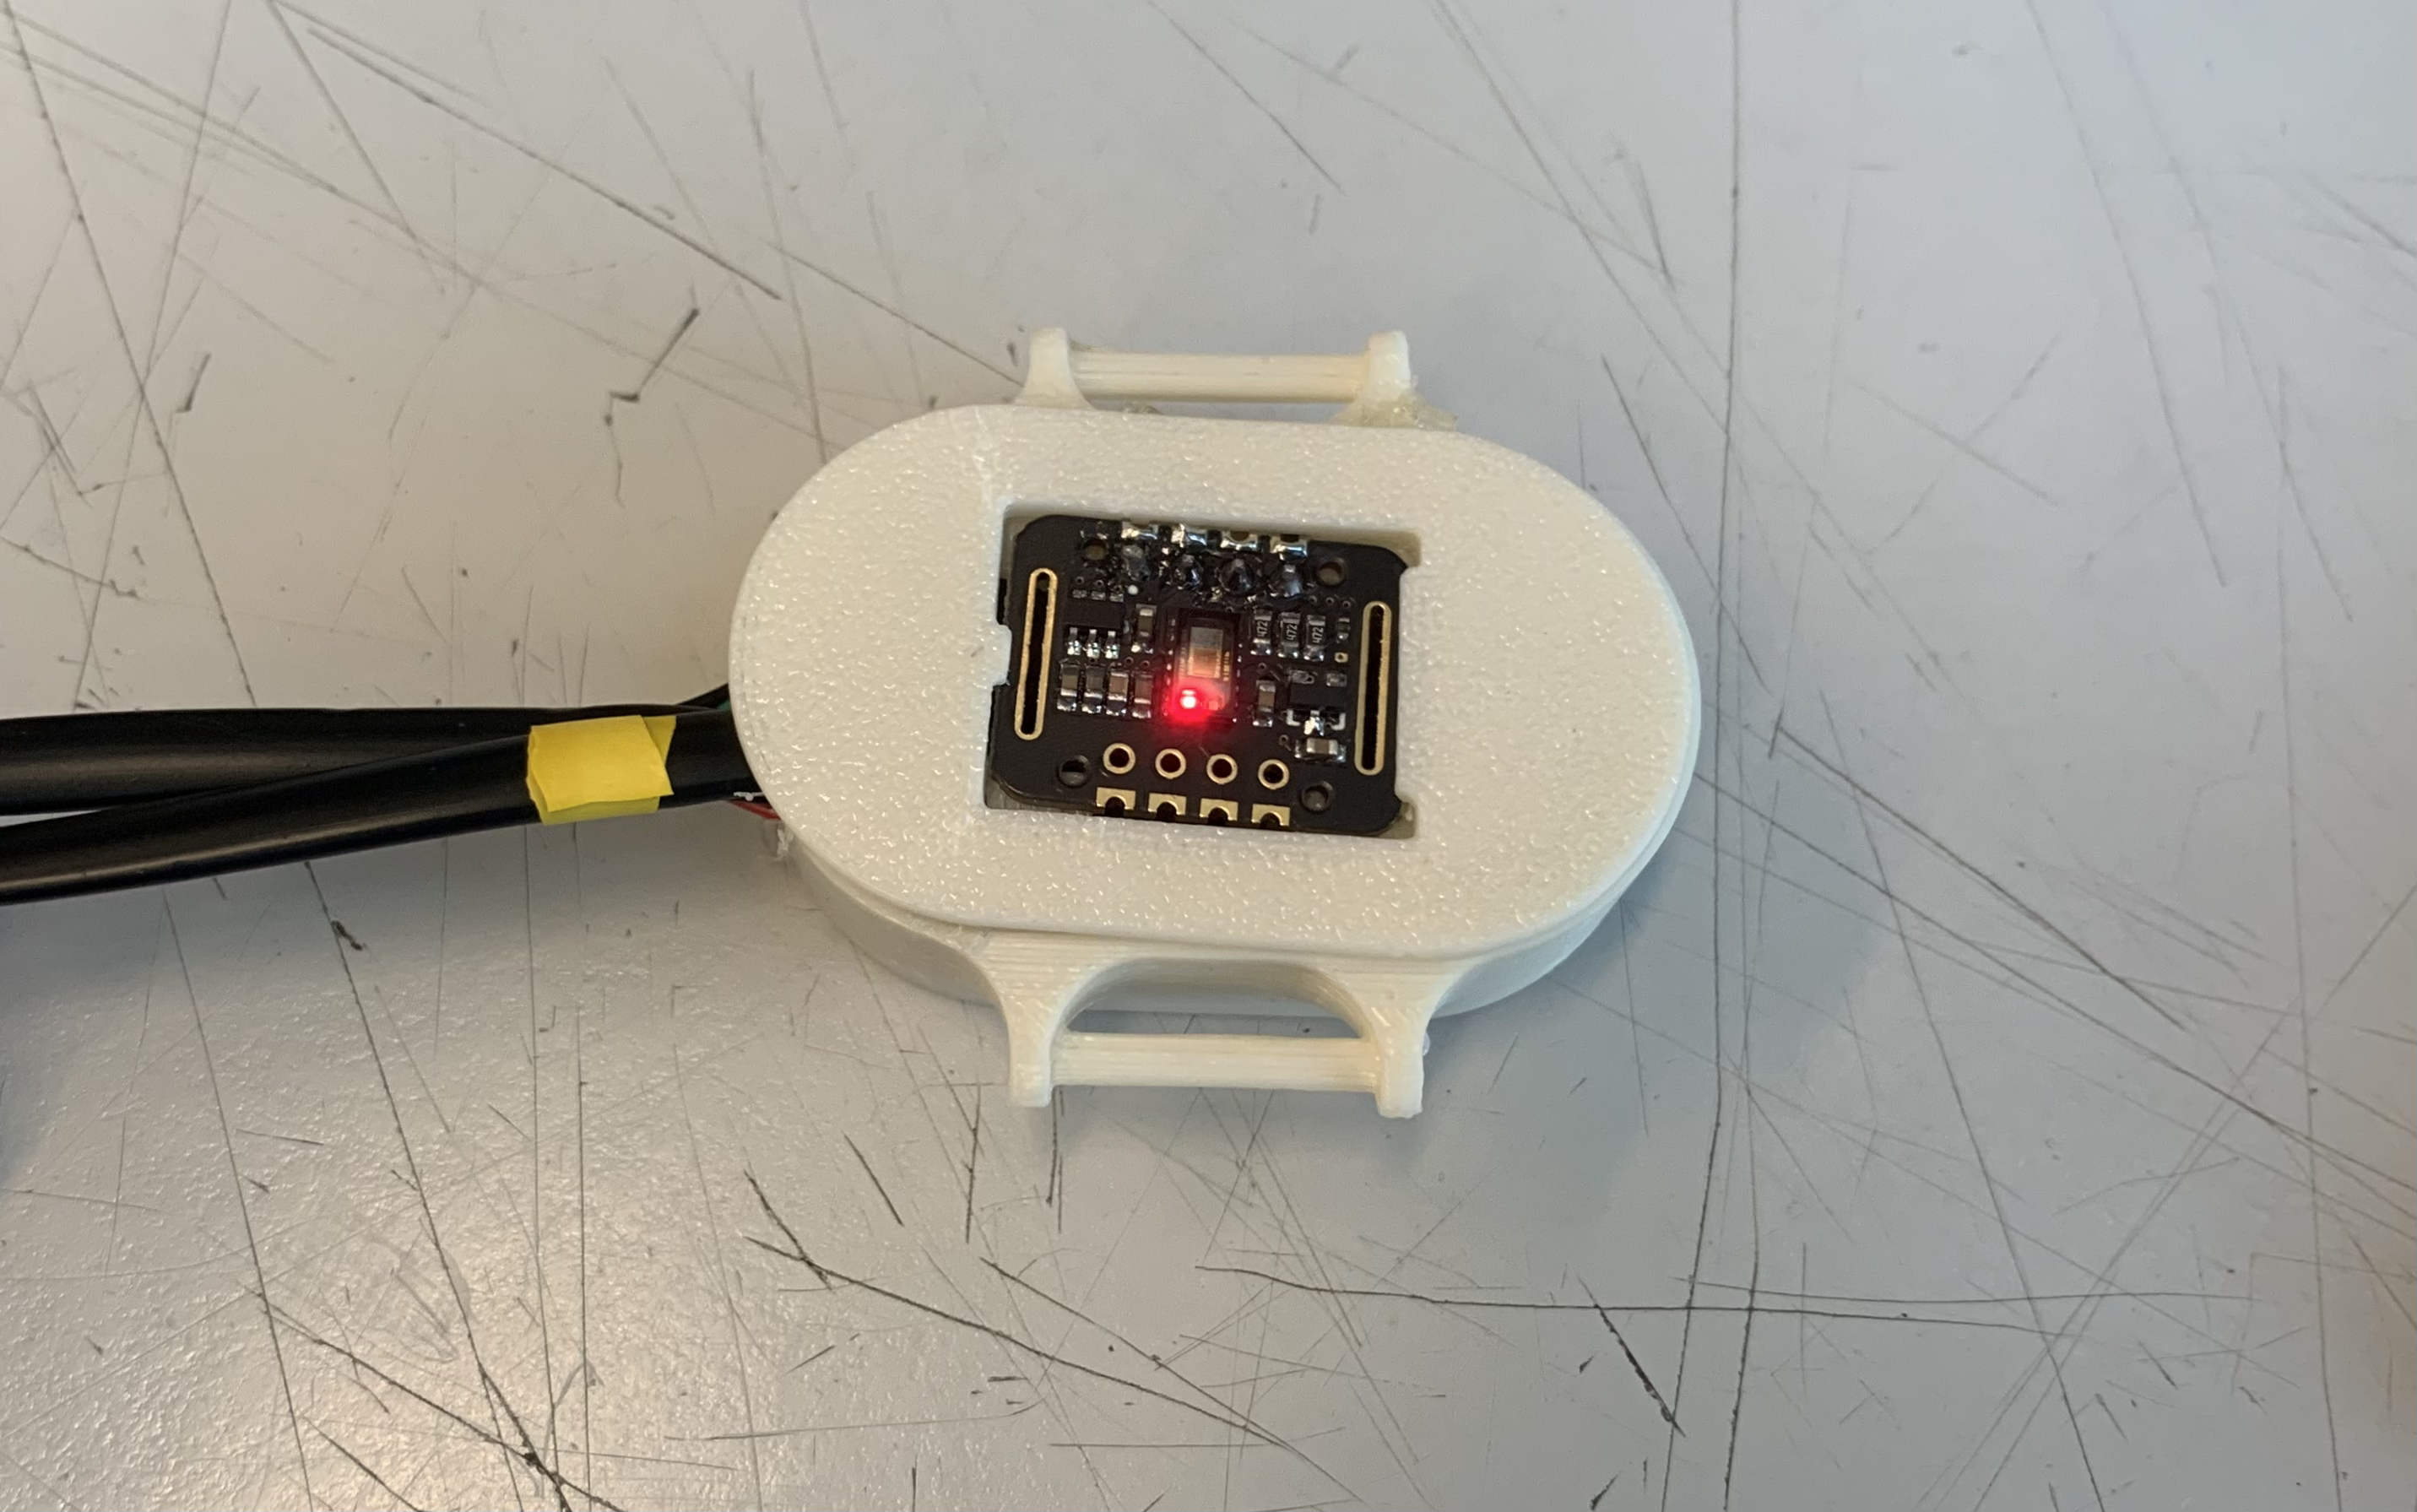

Figure A5. Initial Sensor and Vibration Motor assembly, with and without a finger on the sensor