

Lee Tonkens Yoshida

The team with the headband-integrated system.
Toward A Wearable Haptic Guidance System for Group Bicycling
Project team members: Marissa Lee, Sander Tonkens, and Kyle Yoshida
We investigate the potential of a haptic device to guide a biker in uncertain environments. A gyroscope is mounted on a bike frame, and error between the biker’s current and desired roll angles is input to an actuator control system. The user receives vibration feedback with varying intensity to guide his movement. In a small user study, we compare human response to three feedback conditions: 1) visual, 2) haptic, and 3) haptic and visual. Diminishing RMSE throughout the haptic-only trials suggest that a learning phase occurs, and frequency response data indicate that using only haptic cues results in a smaller gain with a lower cutoff frequency. Results from this study can inform future untethered, multi-rider systems for safe bike riding and navigation.
On this page... (hide)
Introduction
On group bike rides, there can often be confusion about a route. Consequently, if a leading cyclist turns without warning those behind him, large crashes can occur. A helmet-integrated haptic device that provides followers feedback about the leader’s path can reduce this confusion and mitigate crashes. Our proof-of-concept device supports a system that will ultimately take movement data from all bikes in a group and provide feedback to all riders when one person begins to turn.
In this project, we focused on the haptic component of the system. We developed a simple device that provides users vibrational feedback on the forehead based on error between the user’s angle and that of a virtual bike. We conducted a preliminary study to understand the effects of three conditions - visual only, haptic only, and visual-haptic combined feedback - on users’ responses. The results of this study support the feasibility of a wearable haptic guidance system for group bicycling.
Background
Several haptic devices have been designed to aid in biking and navigation. In 2009, Poppinga et al. proposed Tacticycle, a tactile display for use in leisurely, exploratory bike riding. Motivated by the idea of aiding tourists to a final destination without requiring them to take any one particular path, Poppinga et al. equipped a bike with a GPS for localization and a compass for heading. The Tacticycle provided haptic feedback through two tactile actuators attached to the handlebars. Depending on the biker’s heading, the actuators would provide feedback to orient the biker toward his final destination. Feedback was provided using an interpolation method, such that 75% vibrational intensity on the left handle and 25% vibrational intensity on the right handle would indicate that the biker should head to the left at a 45 degree angle. With this system, bikers were able to classify forward direction cues with 44% accuracy and left and right direction cues with 58% accuracy.
Steltenpohl and Bouwer developed the Vibrobelt, a haptic navigation tool that can be worn around the waist (2013). Participants equipped with the Vibrobelt reached the intended destinations and performed comparably to participants equipped with a visual navigation system. Participants reacted positively to the Vibrobelt and its ease of use, user-friendliness, and clarity. Participants indicated that they had a desire to use the system again.
HaptiMoto, a turn-by-turn wearable haptic device proposed in 2014 by Prasad et al., aims to improve safety for motorcyclists using navigation. This system involves instrumenting a motorcycle with a GPS and motorcycle alignment. Using tactile vests, motorcyclists receive cues on the backs of their shoulders, instructing them to turn in the direction of cueing. Participants in this study interpreted four cues for turning left, turning right, making a U-turn, and moving straight, with 100% accuracy and rated the system with a usability of 5.33 ± 1.11 on a 7-point Likert scale, where 7 was the highest usability rating.
In 2017, Alarcón abd Ferrise designed a navigation tool that implemented haptic cueing through the wrists. Bikers turn in the direction of the cue. Two different cues are provided: a single buzz for an upcoming turn and two buzzes for an imminent turn. Users reported positive feedback, citing that the system was intuitive and easy to understand.
These devices all provide cueing for macro-level navigation, where resolution only to the next turn is required. As far as we can tell, no study has been published that describes a system that provides haptic cueing based on bike tilt for turning in uncertain, fast-changing conditions.
Methods
Hardware Design And Implementation
A Hapkit board interfaced with a six-axis inertial measurement system (MPU-6050, gyro + accelerometer) in a GY-521 package and two coin vibration motors (Figure 1). The inertial measurement unit (IMU) interfaced with the Hapkit board via I2C communication, and the coin vibration motors interfaced with the Hapkit board’s motor driver outputs. At its current state, all components of this system are tethered.

Figure 1. Schematic of system hardware.
The IMU was mounted securely to a handlebar post on a bike frame (Figure 2). This post did not rotate relative to the main bike frame.

Figure 2. IMU mounted to bike frame.
For our user study, actuators were taped to participants' foreheads such that the coin vibration motors interfaced with each temple (Figure 3a). We used a stretchable headband for demo day, which improved user comfort when wearing the device (Figure 3b). Users reported that the force felt distributive, which is likely due to using cardboard inside the headband to hold the actuators in place and the material of the headband itself. Both of these will have a damping and distributive effect.

Figure 3. The coin vibration motor interface (a) during the user study and (b) after modifications post-study.
System Control
Vibration control was implemented using a proportional controller, with error between current and desired angular positions as input. As error increased, the amplitude of vibration increased with a gain of 0.03:
Duty Cycle = 0.03(T_actual - T_desired) * 100%
This gain was sufficient to feel cues at small errors between angles, yet not so high that cues became uncomfortable. Using the controller above, a duty cycle less than zero implies that the user is tilted too far to the left, and the right actuator is actuated. A duty cycle greater than zero implies that the user is tilted too far to the right, and the left actuator is actuated. Cueing is only provided to the user if his error from desired angle is greater than 5°.
Guidance was provided in a “pull” configuration, such that a vibration on the left temple meant that the user should lean to the left to correct his position. The choice to use this guidance method is based on the findings from Lurie et al. (2011), which suggest that users find the “pull” metaphor easier to understand and more natural than the opposite “push” metaphor.
Serial communication occurred with a baud rate of 9600, and data was sampled every 40 ms.
In this proof-of-concept, forward Euler integration is used to approximate bike roll angle at every time step. In longer periods of data collection, error accumulation due to integration of angular velocity will result in drift. However, for the purposes of this proof-of-concept, in which data collection periods were under a minute long and data was sampled every 40 ms, forward Euler integration is sufficient.
User Study
We recruited six participants, 1 female and 5 male, mean age 24.7 ± 3.4 years, for our study. Each was presented with three feedback conditions (visual only, haptic only, or combined visual and haptic). With six participants, each received a different permutation of these conditions. Within each condition, there were three trials, each 20 seconds in length. The trial began with a calibration period in which the participant was instructed to stay still. Then, the user was to minimize the error between their bike tilt angle and the desired bike tilt angle, as directed through visual and haptic cues.
A sum of sines reference input was created in MATLAB using random phase shifts and the first 13 prime harmonics of 0.05 Hz with a constant velocity amplitude of 10 deg/s (Figures 4 & 5). The velocity amplitude was held constant so that the user can better track higher frequencies. The frequencies and velocity amplitude were determined from raw cycling data to mimic angles that would be found in the real world.

Figure 4. Sampled sine inputs (0.1, 0.25, and 0.65 Hz) used to generate the sum of sines reference input.

Figure 5. Sum of sines reference input for 10 prime harmonics of 0.05 Hz for the tracking task.
The reference trajectory was plotted to ensure that angular position stayed within a reasonable range (30 degrees based on cycling data). This reference input was then combined with a virtual environment consisting of two rods rotating about a ground point (Figure 6).

Figure 6. Snapshot of visual feedback, where the user's bike tilt is represented by that of the white rod,
and desired bike tilt is represented by that of the red rod.
Using the sum-of-sines method described above, we looked at the frequency response over the reference input of the user and Root Mean Square Error (RMSE) to understand how the different feedback conditions influenced performance.
Using RMSE, we investigated whether there was a learning curve associated with any of the conditions. If there was, we analyzed the third (final) trial of each feedback condition, reducing the impact of learning on the comparison analysis. We investigated whether there was significant difference between the RMSE of different feedback conditions. In addition, we graphed differences in the learning curve slopes between the different feedback forms.
After experiencing all three conditions, participants were asked to rate the likability, comfort, and intuitiveness of the device, as well as the likability of each feedback condition, on a 7-point Likert scale.
Demonstration
On demo day, we presented an improved system. Instead of taping the actuators to the user’s head, as we had done in the study, we integrated them into a stretchable headband. This allowed for improved wearability and comfort. We allowed visitors to demo our device by performing the same sum-of-sines experiment with combined visual and haptic feedback (and, when interested, visual only or haptic only feedback).
Results
RMSE Results
The plot below shows the evolution of the RMSE over the 3 trials. It is clear that there is significant learning occurring in the haptic trials (Figure 7). Consequently, the remainder of the analysis will focus on the third trial.

Figure 7. RMSE mean error and standard deviation over trial for different feedback forms.
Figure 8 compares the RMSE for the 3 different feedback forms for the 3rd trial. The haptic feedback error was shown to be significantly different compared to both the combination of the haptic and visual feedback (P = 0.01) and to the visual feedback (P = 0.02). However, there is no significant difference between the other two feedback modes, indicating that the vision feedback trumps the haptic feedback when both methods are combined.

Figure 8. Comparison of mean RMSE with standard deviation for different haptic feedback forms for the 3rd trial.
To obtain the most objective results we exhausted all different variations of feedback forms for the users. However, observations from the study indicated that users had great difficulty reacting to feedback for their first haptic test when not having had the combination of haptic and visual feedback before. This is clearly shown in Figure 9, and confirms our choice to consider the 3rd trial (where there is no significant difference between the two).

Figure 9. Comparison bf mean RMSE with standard deviation comparing subjects having performed haptic feedback trial before haptic and visual feedback trial and those having performed haptic and visual feedback trial before having performed haptic feedback trial.
In summary, a feedback form that includes visual feedback (which includes your own position and the reference position), is considered as a natural form and does not require any learning. However, this does mean that there is no improvement with time. Contrary to that, the haptic only feedback form is difficult to comprehend for users on the first trial. However, significant learning occurs over the course of the next 2 trials, and the difference in error with the other feedback forms is greatly reduced by the third trial. Our hypothesis is that this error continues to decrease slightly with more trials, but that it will always be a less effective (when measuring error) method than visual feedback.
However, for situations in which visual feedback is impaired (e.g. by the user not concentrating or with sharp corners down a mountainous road), these results show that haptic feedback can serve as an almost as effective guidance tool as visual feedback. Further studies will need to show whether this also holds true for long-term learning.
Frequency Analysis Results
The time domain data (Figure 10) shows movement based on the feedback condition, but it is difficult to decipher performance from this graph. Therefore, frequency analysis is used. Evidence of learning can be found in observing the frequency response differences between the first and last trial of a given sensory condition (Figure 11). In the first and last trials, visual and visual+haptic sensory conditions yield similar curves, but the haptic only condition yields a different curve. For the first trial, the curve for the haptic only condition yields a cutoff frequency lower than that of the visual or visual+haptic curve. During the last trial, however, the haptic condition yields a higher cutoff frequency closer to that of the visual+haptic curve. The phase delay also appears to decrease for the haptic curve after the final trial. Also, all users were provided the same gain, but one user’s gain was lowered due to large amounts of tracking error causing overheating of the motors.

Figure 10. Example time domain response for different feedback conditions.


Figure 11. The bode plot of the first trial shows a smaller cutoff frequency for the haptic-only condition (Top), and the bode plot of the last trial shows a lower gain and high cutoff for the haptic condition (bottom).
The bode plot using all of the trial data shows that the response for the haptic condition has a lower gain overall, with a larger slope when approaching the cutoff frequency of about .8 Hz (Figure 12). Additionally, the phase appears to be the same for all conditions when averaging across trials.

Figure 12. The bode plot using data from all trials shows that the haptic-only condition has a lower cutoff frequency.
Figure 13 provides the standard deviations along with the mean for the last trial for each condition. Most noticeable from these plots is a peak at 0.5 Hz in the gain for the haptic response condition. The heightened gain may be evidence of the use of a form of active sensing. We hypothesize that the haptic condition is more difficult, therefore leading to the user inputting their own frequencies to better understand the system. The peak appears in multiple users and was also visually confirmed in the trials themself, where users begin to move the bike at their own oscillatory pattern when they feel most lost. This frequency at which it occurs may be related to the inertia and damping of the user-bike system.

Figure 13. Mean and standard deviation (shaded region) for the last trial of each condition (n=6).
User Sentiments
At the end of all of the trials, participants were interviewed to collect opinions on the device and the conditions. We asked them to rate on a 7-point Likert scale how much they liked the haptic device, how comfortable it was, and how easy and intuitive it was to use. Users were mixed on their ratings for each of these areas, though they thought the strong points of the device were its comfort and intuitiveness over its total likability (Figure 14).

Figure 14. User responses to likability, comfort, and ease of use of the haptic device. Each labeled color
represents a point on the Likert scale, with 1 being very negative and 7 being very positive.
In follow-up discussions, much of the feedback we received for making the device more likable and comfortable was related to the taping of the device to the participants’ foreheads. In some studies, the actuators became loose due to tape coming off. These discussions suggest that participants may have been affected by the taped actuators in ways that they might otherwise not be with actuators integrated into a helmet or other unobtrusive device.
One participant suggested that they would like the device more if it weren’t located on the forehead. Another participant noted that the intuitiveness of the device improved as time went on. These two comments could be related to the fact that people rarely receive haptic feedback on their foreheads.
We also asked users about how much they liked each of the three conditions. Participants did not like the haptic only condition, and there was slight preference for the haptic + visual condition over the visual only condition (Figure 15). This suggests that participants do not dislike the haptic feedback, but they dislike it when their vision is removed.

Figure 15. User responses to likability of each condition. Each labeled color represents
a point on the Likert scale, with 1 being very negative and 7 being very positive.
At our demonstration, we received comments about how strange vibration on the head felt, consistent with feedback we had received during the study. Future iterations of this device might look at feedback at the hip or the ankles.
Future Work
Our system was tested only with 6 users, all of whom were engineering students with familiarity with haptic devices. Additionally, only one student performed each permutation of trial orders, so it is unknown if there are any effects on trial order that result in a different outcome. With only 3 trials of about 20 seconds, we are also unsure if we have removed learning artifacts. In the future, more users will be tested with the system. Because the bike was stationary and not moving the effects of velocity would also need to be determined, because bike angle and velocity would likely be linked to create a radius of curvature.
From observation and user input, we found that taping actuators to the forehead of the user was quite uncomfortable. This may have created confounding factors making it difficult to complete the experiment. Therefore, we are examining the use of helmets and headbands to improve wearability. We would also have to further understand the damping that the foam of the helmet would provide to the user. Also, the location of feedback can also be re-evaluated. It was noticed that the participants would often tilt their head more than bikes, so we believe that adding feedback in a more distal location would elicit movement of the body rather than just the head, providing the inertial displacement to turn.
In other realms of future work, we want to examine how to integrate this concept into a multi-user system or a system integrated with GPS. With GPS, bike riders can receive feedback to guide them through tricky turns and movements. Also, in a world with increased automation, a haptic feedback system to alert bike riders when cars are approaching could also be useful using a similar device. We can also explore the modulation of actuator gains, angle tolerance, and effects of temporal spacing of the actuators rather than vibration amplitude when delivering feedback. Additionally, other methods such as normal indentation or skin stretch to provide cues can also be examined as they may be more differentiable compared to a vibrotactile cue. There are other filtering methods beside forward Euler integration which can also be considered to minimize integration drift over time.
Acknowledgments
Thanks to our peers who volunteered their time to participate in our user study!
Files
Our files can be found at https://drive.google.com/drive/u/2/folders/1GadVMe1nFWp3vmFSrwRGe3iMp_mmhzHm.
References
- M. C. E. Alarcón and F. Ferrise. Design of a Wearable Haptic Navigation Tool for Cyclists. International Conference on Innovative Design and Manufacturing, 2017.
- K. L. Lurie, P. B. Shull, K. F. Nesbitt, and M. R. Cutkosky. Informing haptic feedback design for gait retraining. IEEE World Haptics Conference, pp. 19-24, 2011.
- B. Poppinga, M. Pielot, and S. Boll. Tacticycle – A Tactile Display for Supporting Tourists on a Bicycle Trip. Human-Computer Interaction with Mobile Devices and Services, 2009.
- M. Prasad, P. Taele, D. Goldberg, and T. Hammond. HaptiMoto: Turn-by-Turn Haptic Route Guidance Interface for Motorcyclists. Human Factors in Computing Systems, 2014.
- H. Steltenpohl and A Bouwer. Vibrobelt: Tactile Navigation Support for Cyclists. Intelligent User Interfaces, 2013.
Appendix: Project Checkpoints
Checkpoint 1
Hardware Design and Implementation
A Hapkit board interfaced with a six-axis inertial measurement system (MPU-6050, gyro + accelerometer) in a GY-521 package and two coin vibration motors (Figure A1). The inertial measurement unit (IMU) interfaced with the Hapkit board via I2C communication, and the coin vibration motors interfaced with the Hapkit board’s motor driver outputs. At its current state, all components of this system are tethered.
Figure A1. Schematic of system hardware.
The IMU was mounted securely to a seatpost on a bike frame (Figure A2).

Figure A2. IMU mounted to bike frame.
The coin vibration motors were integrated into stretchable wristbands and headbands. Users wore either the wristband system or the headband system at any single time. Wristbands were worn on each forearm such that the coin vibration motors interfaced with the dorsal forearm approximately 3 inches from the wrist (Figure A3a). The headband was worn such that the coin vibration motors interfaced with each temple (Figure A3b). For this first pass, a simple stretchable but tight material was used. We plan to use sweatbands (wrist and head) for the demo day. We have experienced some issues with the coin vibration motors heating significantly, so we will have to test with these sweatbands to see if they will allow for a comfortable user experience.

Figure A3. Coin vibration motor interface with user on the (a) wrist and (b) head.
System Control
Vibration control was based on proportional control, with error between current and desired angular positions as input. As error increased, the amplitude of vibration increased with a gain of 0.02:
Duty Cycle = 0.02(T_actual - T_desired) * 100%
This gain was sufficient to feel cues at small errors between angles. A duty cycle less than zero implies that the user is tilted too far to the left, and the right actuator is actuated. A duty cycle greater than zero implies that the user is tilted too far to the right, and the left actuator is actuated.
Guidance was provided in a “pull” configuration, such that a vibration on the left wrist or temple meant that the user should move toward their left to correct their position. The choice to use this guidance method is based on the findings from Luriet et al. (2011), which suggest that users find the “pull” metaphor easier to understand and more natural than the opposite “push” metaphor.
To gain an understanding of the system, data was collected with an SD card. We powered the Arduino with a 9V battery and conducted 4 one-minute-long bike rides. In collecting gyroscope data, we could then integrate data to estimate bike angle. Data from the first 50 seconds of these bike rides is shown below (Figure A4).
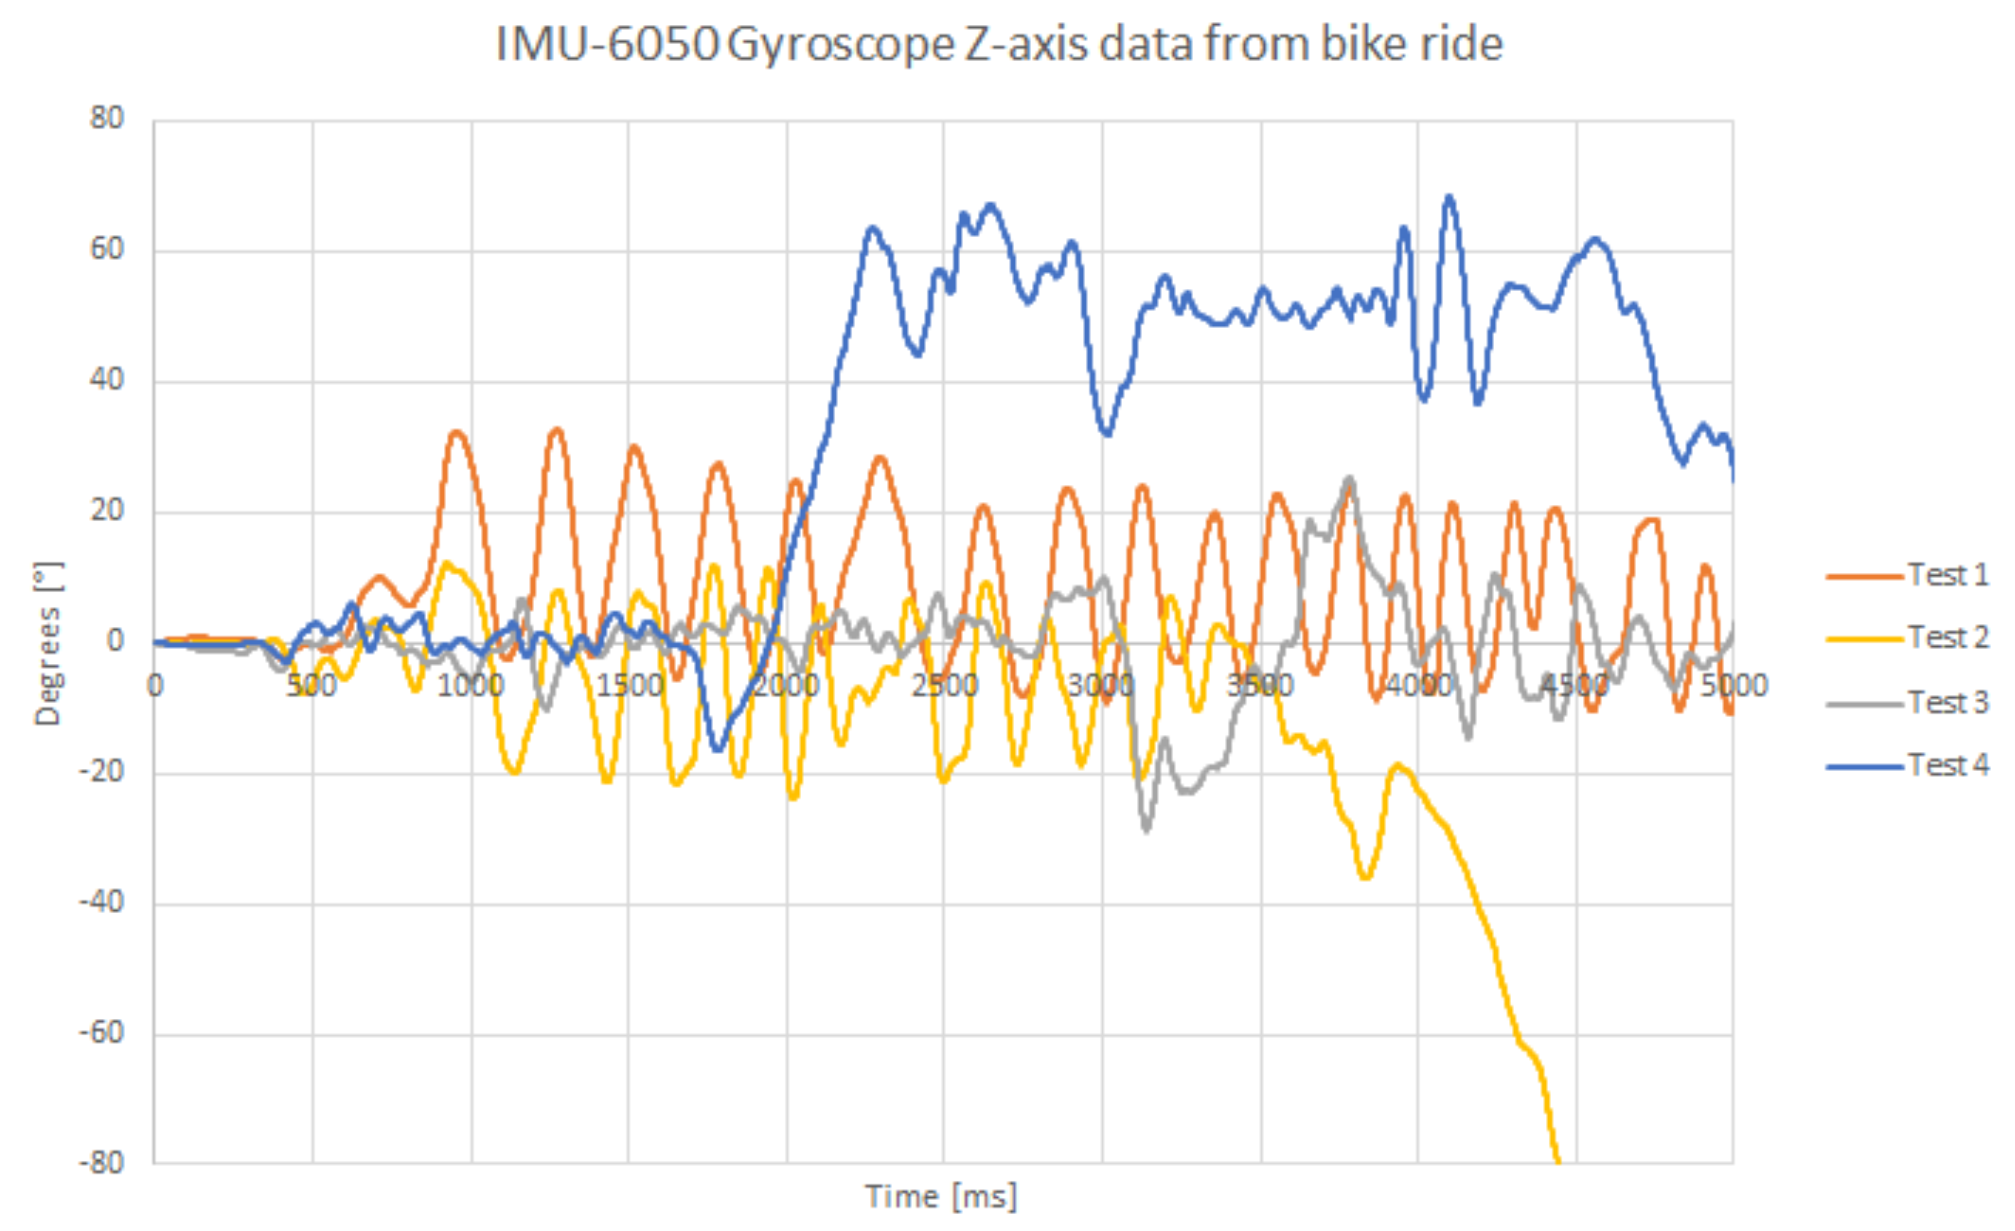
Figure A4. Approximate roll angle data from the five data-collecting bike rides.
These data appear to, on the whole, capture the turns and route taken in the bike rides, with minimal drift in 2 of the rides (Tests 1 and 3), and relatively large drift in 2 other rides (Tests 2 and 4). However, this drift occured during periods in which very abrupt turns (high angular velocity) were made, after which the IMU recovers and stables with a different offset (see Test 4 specifically).
Issues related to drift will be addressed during pilot studies. We will explore how large variations in angular velocity cause drift as we will be able to interpret the data on the spot.
This shows that forward Euler integrating over this short time period is a potentially feasible way to estimate bike angle. (Of course, in longer periods of data collection, error accumulation from integration of angular velocity to find angular position will result in drift. This can be accounted for through filtering and other signal processing methods, but for the purposes of this proof-of-concept project, we plan to use simple numerical integration. If this is not sufficient, we will investigate simple filtering methods.
Another drawback of these data is that they were collected from the IMU mounted on a slightly tilted bike frame. Consequently, analysis of rotation about the z-axis is not the most accurate analysis in determining bike roll angle. The data from the tilted bike frame can be accounted for using simple geometry, or future data can be collected with the IMU mounted on a horizontal or vertical segment of a bike frame.
The data collected suggest that for standard bike riding conditions, maximum angular velocity is ±40°/s, and the most extreme angles achieved are ±30°. These data were important in informing our experimental setup, described in the proceeding section.
Moving forward, we will fine-tune our proportional control in preparation for the experiment by adjusting the gain and exploring the benefits of adding an error allowance region of ±5°.
Experimental Setup
Experimental Overview
Visual and tactile cues will be provided while training with the system to observe what we would expect as the best performance. By using the two modalities combined, users should be able to learn the vibrotactile feedback cues most effectively.
As shown in Figure A5, Rv(s) and Rt(s) are the visual and tactile reference inputs. The visual reference is an oscillating target, while the tactile reference is proportional to Y(s) to promote target convergence. By using vision V(s) and touch T(s), a user will interpret reference cues to feed to the brain C(s) and limbs P(s). This yields a movement output Y(s).

Figure A5. System block diagram relating visual and tactile reference inputs to output angles.
After training (Figure A6), vision can be removed, so the only reference will be from touch T(s). This will allow us to examine how the user will respond to only vibration feedback to follow a specific trajectory.

Figure A6. System block diagram during the experiment shows how outputs will be generated when only tactile cues will be provided.
However, we are still determining if we will completely remove vision, only remove the reference, or just leave all visual cues. This will be determined through pilot testing of the apparatus early next week. If it becomes infeasible for someone to follow the trajectory with only haptic cues, then we will provide the user position. If this is also generating poor results, then full visual cues of the reference and output will be provided, and we will then test performance with vs. without haptic feedback rather than performance with vs. without vision while haptic feedback is held constant. Given that our application is for bicycling, users should have vision while doing the task in the natural environment, but in cases where there is side by side bike riding, vision of the reference (partner biker) would be obstructed. This would follow a case more similar to where vision is no longer provided to the system (Figure A6).
System Identification
A sum of sines reference input was created in MATLAB using random phase shifts and the first 10 prime harmonics of 0.05 Hz with a constant velocity amplitude of 10 deg/s (Figures A7 & A8). The velocity amplitude was held constant so that the user can better track higher frequencies. The frequencies and velocity amplitude were determined from raw cycling data to mimic angles that would be found in the real world.
Figure A7. Sampled sine inputs (0.1, 0.25, and 0.65 Hz) used to generate the sum of sines reference input.
Figure A8. Sum of sines reference input for 10 prime harmonics of 0.05 Hz for the tracking task.
The reference trajectory was plotted to ensure that angular position stayed within a reasonable range (30 degrees based on cycling data). This reference input was then combined with a virtual environment.
These reference inputs will be used to perform system ID to observe user response at a range of frequencies and to generate a bode plot of the response. This will allow us to understand how different vibrotactile feedback placement (head vs. hands) or vibrotactile control strategies can influence performance.
Virtual Environment
A virtual environment was created in processing to visualize a line for the reference input and a simulated user output. The simulated user output was created by applying a gain and slight phase delay, mimicking what would be expected in the experiment. The processing code takes in two inputs for the reference and current angular positions, then uses those to generate a line showing the angle. The angular error is calculated and displayed for the user. To improve the virtual environment, a similar method to Pezent et al. (2018) might be used where the user can see their position and not the reference position. Additionally, the color of the bar could be made proportional to the error to help the user identify error, without knowing the reference angular position. This weekend, we will run pilot tests to see if tracking is too difficult with no visual inputs, or if the user output is necessary with the reference input hidden.
Trial Setup
Next week, 5 people will be provided a bike with a mounted IMU. They will be provided either the headband or wristband for haptic feedback first to do the task. The task will consist of tilting the bar in free space based on visual and haptic feedback in a 30 second training trial, then using only haptic feedback in 3 subsequent 30 second trials. Time domain averaging will be used between the 3 trials, and the last 15 seconds will be used to generate a bode plot of the user response. The experiment will then be repeated on the same subject when using feedback on the second area. The RMSE will also be calculated as a measure of task tracking performance. Again, the existence of visual cues will depend on pilot studies this weekend.
Next Steps
Our focus for the next week will be collecting and analyzing data from our user study. Once this is completed, we will collect more real-world biking data for our project demonstration. We will develop a virtual environment that displays the desired and actual courses for onlookers to track how a user is doing, and we will set up two systems on the same bike such that it is simple to switch between wristband and headband feedback during the demo (or we will select only the more successful form of guidance to demo).
Sources
- K. L. Lurie, P. B. Shull, K. F. Nesbitt, and M. R. Cutkosky. Informing haptic feedback design for gait retraining. IEEE World Haptics Conference, pp. 19-24, 2011.
- E. Pezent, S. Fani, J. Bradley, M. Bianchi, and M. K. O’Malley. Separating haptic guidance from task dynamics: A practical solution via cutaneous devices. IEEE Haptics Symposium, 2018.
Checkpoint 2
We made a significant shift in our objectives. We will no longer be comparing wrist vs head vibrotactile feedback, but will compare three feedback methods: haptic feedback only to the forehead, visual feedback only and a combination of the two. This study direction shift is supported by the reason that we want to determine whether haptic feedback to the forehead is an effective way to provide feedback, when compared to the standard visual feedback. We chose to only look at haptic feedback to the forehead as our pilot indicated this was a more desirable way of providing feedback. In addition, it has the possibility to be integrated in equipment a cyclist already uses, the helmet.
We developed a virtual environment with two pivoting arms, one showing the desired angle, the other showing the user’s angle. We proceeded by running a user study (n = 6) to determine the frequency responses comparing haptic only feedback, vision feedback (through the virtual environment), and haptic and vision feedback and did a preliminary analysis of the results. However, we decided to not create a more advanced virtual environment which would display the desired and actual courses tracked by the user.
To prepare for demo day, we bought a headband in which we will embed the vibration sensors. We plan to record extra qualitative data during the demo day, but will not perform a thorough frequency response analysis.
Introduction
On group bike rides, there can often be confusion about a route. Consequently, if a leading cyclist turns without warning those behind him, large crashes can occur. A helmet-integrated haptic device that provides followers feedback about the leader’s path can reduce this confusion and mitigate crashes. Our proof-of-concept device supports a system that will ultimately take movement data from all bikes in a group and provide feedback to all riders when one person begins to turn.
In this project, we focused on the haptic component of the system. We developed a simple device that provides users vibrational feedback on the forehead based on error between the user’s angle and that of a virtual bike. We conducted a preliminary study to understand the effects of three conditions - visual only, haptic only, and visual-haptic combined feedback - on users’ responses. The results of this study support the feasibility of a wearable haptic guidance system for group bicycling.
Background
Several haptic devices have been designed to aid in biking and navigation. In 2009, Poppinga et al. proposed Tacticycle, a tactile display for use in leisurely, exploratory bike riding. Motivated by the idea of aiding tourists to a final destination without requiring them to take any one particular path, Poppinga et al. equipped a bike with a GPS for localization and a compass for heading. The Tacticycle provided haptic feedback through two tactile actuators attached to the handlebars. Depending on the biker’s heading, the actuators would provide feedback to orient the biker toward his final destination. Feedback was provided using an interpolation method, such that 75% vibrational intensity on the left handle and 25% vibrational intensity on the right handle would indicate that the biker should head to the left at a 45 degree angle. With this system, bikers were able to classify forward direction cues with 44% accuracy and left and right direction cues with 58% accuracy.
Steltenpohl and Bouwer developed the Vibrobelt, a haptic navigation tool that can be worn around the waist (2013). Participants equipped with the Vibrobelt reached the intended destinations and performed comparably to participants equipped with a visual navigation system. Participants reacted positively to the Vibrobelt and its ease of use, user-friendliness, and clarity. Participants indicated that they had a desire to use the system again.
HaptiMoto, a turn-by-turn wearable haptic device proposed in 2014 by Prasad et al., aims to improve safety for motorcyclists using navigation. This system involves instrumenting a motorcycle with a GPS and motorcycle alignment. Using tactile vests, motorcyclists receive cues on the backs of their shoulders, instructing them to turn in the direction of cueing. Participants in this study interpreted four cues for turning left, turning right, making a U-turn, and moving straight, with 100% accuracy and rated the system with a usability of 5.33 ± 1.11 on a 7-point Likert scale, where 7 was the highest usability rating.
In 2017, Alarcón abd Ferrise designed a navigation tool that implemented haptic cueing through the wrists. Bikers turn in the direction of the cue. Two different cues are provided: a single buzz for an upcoming turn and two buzzes for an imminent turn. Users reported positive feedback, citing that the system was intuitive and easy to understand.
These devices all provide cueing for macro-level navigation, where resolution only to the next turn is required. As far as we can tell, no study has been published that describes a system that provides haptic cueing for turning in uncertain, fast-changing conditions.
Methods
Hardware Design And Implementation
A Hapkit board interfaced with a six-axis inertial measurement system (MPU-6050, gyro + accelerometer) in a GY-521 package and two coin vibration motors (Figure 1). The inertial measurement unit (IMU) interfaced with the Hapkit board via I2C communication, and the coin vibration motors interfaced with the Hapkit board’s motor driver outputs. At its current state, all components of this system are tethered.
Figure 1. Schematic of system hardware.
The IMU was mounted securely to a handlebar post on a bike frame (Figure 2). This post did not rotate relative to the main bike frame.
Figure 2. IMU mounted to bike frame.
For our user study, actuators were taped to participants' foreheads such that the coin vibration motors interfaced with each temple (Figure 3). We plan to use a stretchable headband for demo day after testing to see how signals are damped.

Figure 3. The coin vibration motor interface with a user.
System Control
Vibration control was implemented using a proportional controller, with error between current and desired angular positions as input. As error increased, the amplitude of vibration increased with a gain of 0.03:
Duty Cycle = 0.02(T_actual - T_desired) * 100%
This gain was sufficient to feel cues at small errors between angles, yet not so high that cues became uncomfortable. Using the controller above, a duty cycle less than zero implies that the user is tilted too far to the left, and the right actuator is actuated. A duty cycle greater than zero implies that the user is tilted too far to the right, and the left actuator is actuated. Cueing is only provided to the user if his error from desired angle is greater than 5°.
Guidance was provided in a “pull” configuration, such that a vibration on the left temple meant that the user should lean to the left to correct his position. The choice to use this guidance method is based on the findings from Luriet et al. (2011), which suggest that users find the “pull” metaphor easier to understand and more natural than the opposite “push” metaphor.
Serial communication occurred with a baud rate of 9600, and data was sampled every 40 ms.
In this proof-of-concept, forward Euler integration is used to approximate bike roll angle at every time step. In longer periods of data collection, error accumulation due to integration of angular velocity will result in drift. However, for the purposes of this proof-of-concept, in which data collection periods were under a minute long and data was sampled every 40 ms, forward Euler integration is sufficient.
User Study
We look at the frequency response over the reference input of the user and the Root Mean Squared Error (RMSE) to understand how the different feedback methods influence performance.
For the RMSE we will investigate whether there is a learning curve to account for in any of the methods. If there is, we will also analyze the third and final trial of each feedback method with each other, hence partially accounting for the learning curve. We will investigate whether there is a significant difference between the different feedback forms. In addition, we will look whether there is a significant difference in the learning curve slope between the different feedback forms.
Demonstration
On demo day, we plan to present an improved system that was used in our study. Instead of taping the actuators to the user’s head, we will integrate them into a headband. This will allow for improved wearability and comfort. We will allow people to demo our device by performing the same sum-of-sines experiment with only the vibrotactile feedback. This will allow them to experience using the device, and we will also collect responses for improving the system.
Results
RMSE Results
The plot below shows the evolution of the RMSE over the 3 trials. It is clear that there is significant learning occuring in the haptic trials, hence we will focus our analysis on the 3rd trial for the quantitative analysis. <TODO: T-test on significance of learning curve> (Figure 4).
Figure 4. RMSE mean error and standard deviation over trial for different feedback forms.
Figure 5 compares the RMSE for the 3 different feedback forms for the 3rd trial. The haptic feedback error was shown to be significantly different compared to both the combination of the haptic and visual feedback (P = 0.01) and to the visual feedback (P = 0.02). However, there is no significant difference between the other two feedback modes, indicating that the vision feedback trumps the haptic feedback when both methods are combined.
Figure 5. Comparison of mean RMSE with standard deviation for different haptic feedback forms for the 3rd trial.
To obtain the most objective results we exhausted all different variations of feedback forms for the users. However, observations from the study indicated that users had great difficulty reacting to feedback for their first haptic test when not having had the combination of haptic and visual feedback before. This is clearly shown in Figure 6 below, and strengthens our choice to consider the 3rd trial (where there is no significant difference between the two).
Figure 6. Comparison bf mean RMSE with standard deviation comparing subjects having performed haptic feedback trial before haptic and visual feedback trial and those having performed haptic and visual feedback trial before having performed haptic feedback trial.
Frequency Analysis Results
Observing the time domain data (Figure 7), we can see how tracking changes based on the feedback condition. Evidence of learning can be found in observing the frequency response differences between the first and last trial of a given sensory condition (Figure 8). In the first and last trials, visual and visual+haptic sensory conditions yield similar curves, but the haptic only condition yields a different curve. For the first trial, the curve for the haptic only condition yields a cutoff frequency lower than that of the visual or visual+haptic curve. During the last trial, however, the haptic condition yields a higher cutoff frequency closer to that of the visual+haptic curve. The phase delay also appears to decrease for the haptic curve after the final trial. Also, all users were provided the same gain, but one user’s gain was lowered due to large amounts of tracking error causing overheating of the motors.
Figure 7. Example time domain response for different feedback conditions.
Figure 8. The bode plot of the first trial shows a smaller cutoff frequency for the haptic-only condition (Top), and the bode plot of the last trial shows a lower gain and high cutoff for the haptic condition (bottom).
The bode plot using all of the trial data shows that the response for the haptic condition has a lower gain overall, with a larger slope when approaching the cutoff frequency of about .8 Hz (Figure 9). Additionally, the phase appears to be the same for all conditions when averaging across trials.
Figure 9. The bode plot using data from all trials shows that the haptic-only condition has a lower cutoff frequency.
Figure 10 provides the standard deviations along with the mean for the last trial for each condition. Most noticeable from these plots is a peak at 0.5 Hz in the gain for the haptic response condition. The heightened gain may be evidence of the use of a form of active sensing. We hypothesize that the haptic condition is more difficult, therefore leading to the user inputting their own frequencies to better understand the system. The peak appears in multiple users and was also visually confirmed in the trials themself, where users begin to move the bike at their own oscillatory pattern when they feel most lost. This frequency at which it occurs may be related to the inertia and damping of the user-bike system.
Figure 10. Mean and standard deviation (shaded region) for the last trial of each condition (n=6).
User Sentiments
At the end of all of the trials, participants were interviewed to collect opinions on the device and the conditions. We asked them to rate on a 7-point Likert scale how much they liked the haptic device, how comfortable it was, and how easy and intuitive it was to use. Users were mixed on their ratings for each of these areas, though they thought the strong points of the device were its comfort and intuitiveness over its total likability (Figure 11).
Figure 11. User responses to likability, comfort, and ease of use of the haptic device. Each labeled color
represents a point on the Likert scale, with 1 being very negative and 7 being very positive.
In follow-up discussions, much of the feedback we received that might make the device more likable and comfortable was related to the taping of the device to the participants’ foreheads. In some studies, the actuators became loose due to tape coming off. These discussions suggest that participants may have been affected by the taped actuators in ways that they might otherwise not be with actuators integrated into a helmet or other unobtrusive device.
One participant suggested that they would like the device more if it weren’t located on the forehead. Another participant noted that the intuitiveness of the device improved as time went on. These two comments could be related to the fact that people rarely receive haptic feedback on their foreheads.
We also asked users about how much they liked each of the three conditions. Participants did not like the haptic only condition, and there was slight preference for the haptic + visual condition over the visual only condition (Figure 12). This suggests that participants do not dislike the haptic feedback, but they dislike it when their vision is removed.
Figure 12. User responses to likability of each condition. Each labeled color represents
a point on the Likert scale, with 1 being very negative and 7 being very positive.
Future Work
Our system was tested only with 6 users, all of whom were engineering students with familiarity with haptic devices. Additionally, only one student performed each permutation of trial orders, so it is unknown if there are any effects on trial order that result in a different outcome. With only 3 trials of about 20 seconds, we are also unsure if we have removed learning artifacts. In the future, more users will be tested with the system. Because the bike was stationary and not moving the effects of velocity would also need to be determined, because bike angle and velocity would likely be linked to create a radius of curvature.
From observation and user input, we found that taping actuators to the forehead of the user was quite uncomfortable. This may have created confounding factors making it difficult to complete the experiment. Therefore, we are examining the use of helmets and headbands to improve wearability. We would also have to further understand the damping that the foam of the helmet would provide to the user. Also, the location of feedback can also be re-evaluated. It was noticed that the participants would often tilt their head more than bikes, so we believe that adding feedback in a more distal location would elicit movement of the body rather than just the head, providing the inertial displacement to turn.
In other realms of future work, we want to examine how to integrate this concept into a multi-user system or a system integrated with GPS. We can also explore the modulation of actuator gains, angle tolerance, and effects of temporal spacing of the actuators rather than vibration amplitude when delivering feedback. Additionally, other methods such as normal indentation or skin stretch to provide cues can also be examined as they may be more differentiable compared to a vibrotactile cue. There are other filtering methods beside forward Euler integration which can also be considered to minimize integration drift over time.
References
- M. C. E. Alarcón and F. Ferrise. Design of a Wearable Haptic Navigation Tool for Cyclists. International Conference on Innovative Design and Manufacturing, 2017.
- K. L. Lurie, P. B. Shull, K. F. Nesbitt, and M. R. Cutkosky. Informing haptic feedback design for gait retraining. IEEE World Haptics Conference, pp. 19-24, 2011.
- B. Poppinga, M. Pielot, and S. Boll. Tacticycle – A Tactile Display for Supporting Tourists on a Bicycle Trip. Human-Computer Interaction with Mobile Devices and Services, 2009.
- M. Prasad, P. Taele, D. Goldberg, and T. Hammond. HaptiMoto: Turn-by-Turn Haptic Route Guidance Interface for Motorcyclists. Human Factors in Computing Systems, 2014.
- H. Steltenpohl and A Bouwer. Vibrobelt: Tactile Navigation Support for Cyclists. Intelligent User Interfaces, 2013.