

Mohtasham Yuan Yako

Caption:
1-DoF haptic device.
Data-Driven Force Feedback
Project team member(s): Delara Mohtasham, Connor Yako, & Shenli Yuan
During a virtual interaction, feeling the appropriate force feedback can give the illusion that you are touching a real object. Most modern haptic devices give feedback that is either data-driven or based on a dynamic model. This project aims to use a data-driven model to accurately relay the compliance of deformable objects and the feeling of pressing various mechanical switches using a one degree-of-freedom haptic device. In using a data-driven model, we hope to create a more realistic feeling of touching an object by fitting experimental data to a generic dynamic model.

Figure 1. Team on demo day.
On this page... (hide)
Introduction
Models are only models, and sometimes cannot fully capture a real-world phenomenon. This can be a drawback of rendering virtual environments, where interactions with this environment feel, well, unrealistic. Our project and method aim to close the gap between real and virtual by sampling objects and then playing back their "feel" in real-time.
Currently, this feel is rendered using force and displacement data gathered by a force sensor and an encoder, but in the future we hope to include additional data such as velocity and acceleration to better capture the entire dynamics of real-world objects that we sample. The results from this project showcase the feasibility of data-driven haptic feedback, as well as its shortcomings and potential solutions.
Background
There are several prior works that use data-driven haptic feedback for the rendering of virtual objects. For example, in MacLean (1996) active probing of an object led to collection of force, position, velocity, and inertial data that was used to estimate the stiffness of a toggle switch, which exhibits nonlinear impedance. This nonlinearity was captured by a piecewise linear model.This active probe technique was combined with knowledge of an underlying model of the toggle switch, and then playback was implemented with the resulting determined model. Only stiffness of the toggle switch was estimated. The results showed that real-time modelling and playback created a realistic representation of the physical device without having to spend significant time implementing and fitting an entire model to the complete dynamics of the system (velocity, acceleration, etc.).
In Okamura et al. (2003), the feedback for cutting tissue using virtual scissors was implemented in several ways, one of which used a piece-wise linear fit of recorded experimental force-angular displacement data. The results of this paper showed that users could not differentiate between complex recorded force-displacement data and a piece-wise linear fit during playback.
Kuchenbecker et al. (2005) investigated increasing the realism of tapping on virtual objects. Instead of simply using only a restoring force (such as a spring force) that is dependent on a user's penetration into a virtual wall, high-frequency transient forces are also displayed on top of this restoring force to provide a more realistic experience. These high-frequency transient forces create accelerations at the end-effector and can be measured and characterized by inverting the system's transfer function to be from force to acceleration. Taking data for a variety of combinations of acceleration and incoming velocity, a database of transients was created and then used in open-loop playback on top of the traditional restoring force at the point of contact. User studies validated the realism of using these overlays for the rendering of harder surfaces.
Colton and Hollerbach (2007) investigated the use of a nonlinear model to capture the full dynamics of push buttons. The captured force vs. position, velocity, and acceleration data was used to determine what set of parameters fit the data the best. The same input was applied to the physical the device and the model with the observed output forces tracking relatively well.
All of the above mentioned papers show the viability of data-driven modelling in terms of accuracy and simplicity, as well as the ability to render and playback complex transients to enhance the realism of virtual environments.
Methods
Mechanical design
The mechanical design of our device is similar to the HapKit as it is driven by a capstan drive with a transmission ratio of 20:1. For ease of data collection and haptic playback the capstan drive is oriented horizontally. The CAD Assembly and 3D printed device are shown in Figures 2 and 3, respectively.
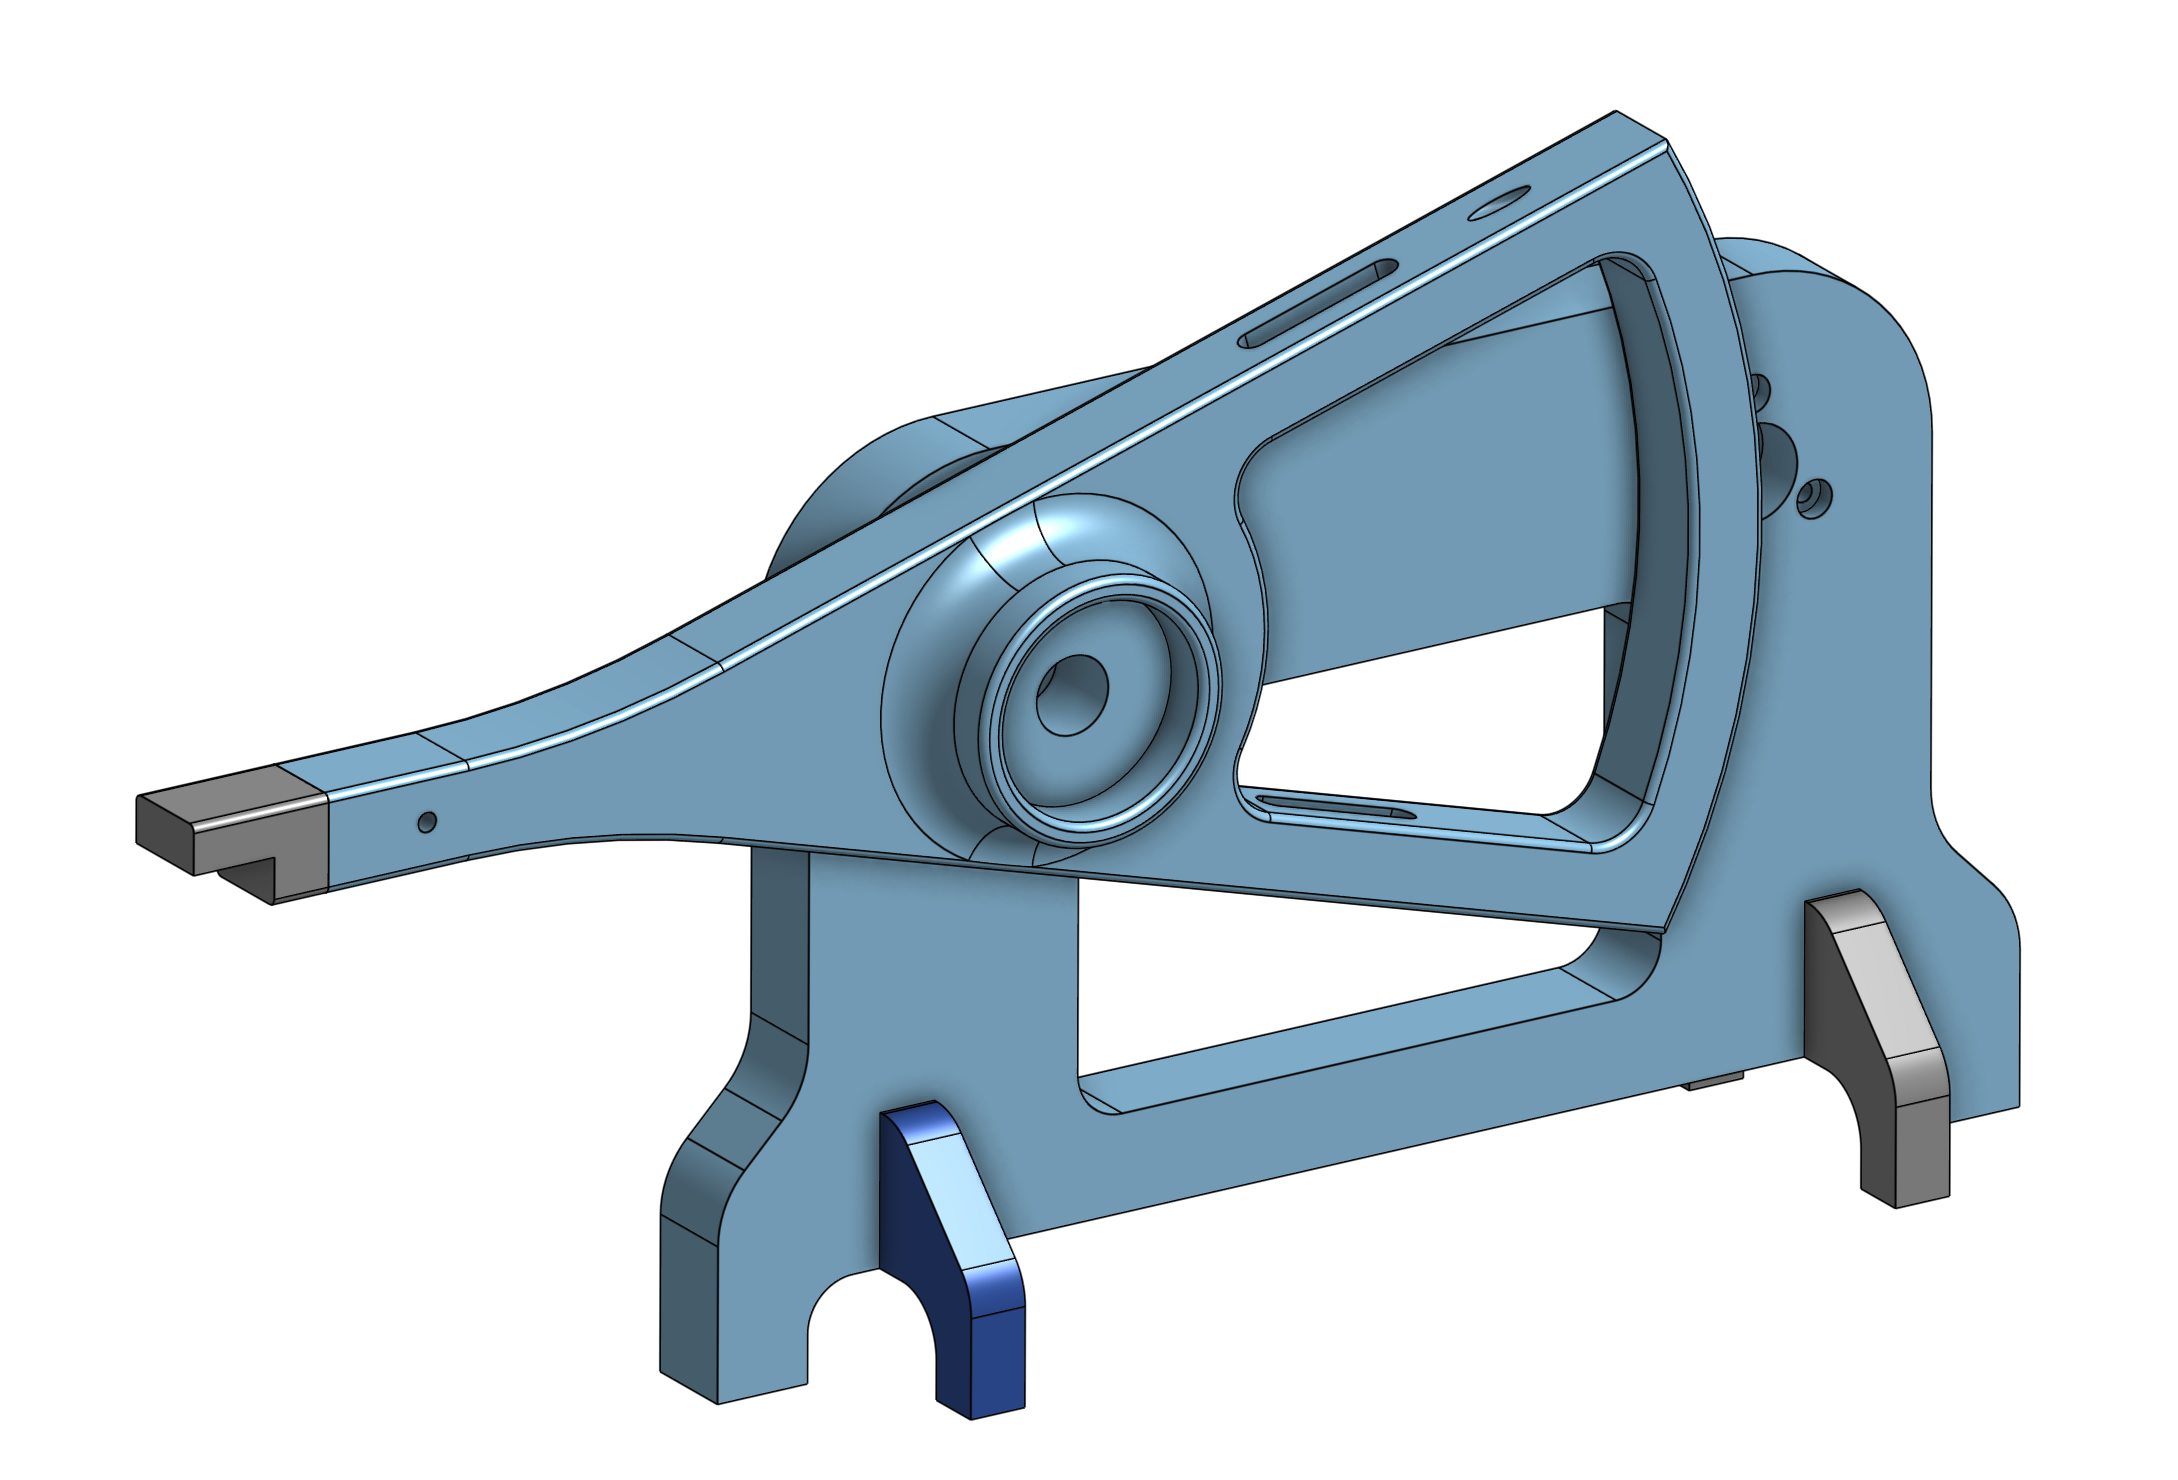
Figure 2. CAD of haptic device.
Figure 3. Haptic device.
The tip of the handle is a rotatable attachment that mounts the force sensor. A pin locks the shaft of the attachment piece to the haptic device. This was designed to allow us to turn the force sensor downward or upward during the data-collection and playback periods. The attachment piece is shown in Figure 4 below.

Figure 4. Rotatable sensor mount.
The full assembly is shown in Figures 5 and 6. The haptic device is screwed to a lasercut acrylic base to stabilize the device and dampen unwanted vibrations. Additional pieces were lasercut to elevate sample objects and ensure that the device could interact with the object without exceeding its range. All the electronics sit in the back of the base.

Figure 5. Final CAD assembly.

Figure 6. Final assembly.
Electrical design
The actuator is a brushed Maxon DC motor with a 14-bit magnetic encoder for position sensing. A 1-DoF 20N Honeywell force sensor is placed on the end of the handle and is used for data-collection and haptic playback. The schematic for the electrical design is shown in Figure 7. Please refer to the "FILES" section for the list of components and estimated cost.

Figure 7. Schematic of electronics.
Software
All the low-level control and data processing are handled by the microcontroller (MCU), while the user interface (UI) is implemented in the Processing software. The UI interacts with the microcontroller through serial communication. When certain buttons are pressed in the serial window of Processing, corresponding values will be sent to Arduino to trigger an event. The state diagrams are shown in Figure 8. Both UI and MCU begin in the "wait" state where the user has the option to collect or playback data for a given sample. When the user decides to sample data, the MCU will receive a signal from UI and begin collecting data. The device will continue collecting data until the force sensor saturates or the user decides to stop sampling. This feature was implemented in case we run in any issues during the sampling period. In the playback state, the user also has the option to stop playing which allows them to return to the "wait" state.

Figure 8. State diagram for Arduino (blue) and Processing IDE (green).
Data processing
After collecting sample data for an object, the data is processed to eliminate noise and repeated data points. A simple algorithm implemented in Arduino checks for repeated data points in the array of position values and removes them. Repeated data might occur from a large time step or the physical device stalling during data collection. A piece-wise linear fit is then implemented to interpolate the data points, which are taken at one-degree sampling increments. The processed data is saved on the SD card on the microcontroller, and is retrieved during playback.
User interface
Our UI was created in Processing. The main page features two rows of five buttons and an additional row with five textfields. The top row of buttons are for sampling, i.e., the user can click this button to capture the real-time force displacement curve of an object that he or she places underneath the 1 DoF haptic device. The bottom row of buttons correspond to the playback of the sampled object previously defined by the user, and when pressed allow the user to feel the force-displacement curve of the sampled object without the object physically underneath the device. Before initiating sampling, an instruction pops-up and directs the user to orient the force sensor downwards and place the object underneath the device. Once the user clicks "Ready!" the device initiates the sampling process. Once complete, the UI returns to the main page. From here the user can either resample an object, continue to sample more objects, or click one of the playback buttons to virtually feel a sampled object. Before playback, an instruction pops-up and directs the user to orient the force sensor upwards and remove the object. Upon clicking "Ready!" playback starts and the user can terminate this mode at any time by clicking "Stop". Samples can be named by typing in the textfields and clicking enter, which populates the corresponding "Sampling" and "Playback" buttons with the user's desired identifier. Additionally, Processing communicates with Arduino to ensure that each program's respective states are synced up correctly. This synchronization is described in the above state machines. Below is a short demo video of the UI.
System analysis and control
During the sampling period we used proportional-integral-derivative control to collect data. The block diagram is shown in Figure 9. Our setpoints were based on angular position. We had the haptic device increment every one degree and collected force vs. position data at every increment.

Figure 9. Block diagram for sampling period.
The block diagram for the playback period is shown in Figure 10. Our setpoint was based on the force data collected during sampling. We found that proportional control was sufficient to get the desired behavior. Integral control would not be desirable for playback because the error would excessively accumulate when the user is interacting with the device. We applied a gain to the derivative of the measured position to provide damping and keep our system passive.

Figure 10. Block diagram for playback period.
Results
Testing
When data is being collected, the force sensor is turned downwards to make contact with an object placed underneath. After the sampling period is over, the force sensor is turned upward and the filtered data is relayed back to the user as they press on the sensor. Figures 11 and 12 demonstrate this process. The video below shows sample data being collected for the ratcheting mechanism on a bike light. The device continues collecting data until the force sensor saturates, then pops back.

Figure 11. Data collection for wall switch.

Figure 12. Playback for the wall switch.
We collected force vs. position data for a computer keyboard, wall switch, lever switch, push button, bike light ratcheting mechanism, pliers, and mouse wheel click. The filtered data for some of the objects are shown in Figures 13-16. This data was played back to the user while taking into account the force from the user's fingertip.

Figure 13. Processed data for computer keyboard.

Figure 14. Processed data for wall switch.

Figure 15. Processed data for lever switch.

Figure 16. Processed data for bike light ratcheting mechanism.
User study
During the open house on June 4, 2019, we conducted a user study to understand how effectively our device recreated the haptic feeling of different objects. When people visited our booth we had them interact with a chosen object and fill out the short survey shown in Figure 17. The survey asks them to rate the object on a scale of 1 to 5, with 1 being "not realistic at all" and 5 being "very realistic". Our goal was to create no noticeable difference between the real and virtual interaction.

Figure 17. Survey for user study.
Participants had the option to choose from the objects shown in Figure 18. From left to right, we had the ratcheting mechanism for a bike light, push button, pliers, wall switch, and the click of a mouse wheel.

Figure 18. Objects on demo day.
The results of the survey are shown below. We received a total of 24 responses. In general people were most curious about the bike light and wall switch. On a scale of 1 to 5, the bike light received an average score of 4.1 and the wall light received an average score of 4.3. Based on these scores and in-person feedback, we were happy to see that most people thought the objects felt realistic. Although we did not receive many responses for the other objects, we did notice some trends. Certain objects were difficult to emulate, such as push button and right click. This is mainly due to the limited travel when pushing on the object. The ridges of the bike light were distinctive but a higher resolution force sensor might make the feeling more realistic.

Figure 19. Results from user study.
Future Work
As force feedbacks from real-world systems do not only depend on the travel depths, future work could include taking into account the position, velocity, and acceleration in the data-driven model. Including more dimensions in the data-driven model would allow us to recreate force feedback for more dynamic systems or even dynamic-dominant systems. It is worth mentioning that adding dimensions in this data-driven approach would require a much larger amount of data sampling. In our case, we would need to sample the force feedback with different combinations of position, velocity, and acceleration in order to create a robust force feedback model. Further development of this project might include developing wearable or mobile devices that would sample data from 3D physical space and recreate the haptic map of the physical world. Accurate position tracking would be the key to success in this direction. Additionally, we could include multi-modal feedback during playback, such as the auditory click of a button or the sound when tapping on a hard surface, which could be captured by these wearable devices. Learning could also be implemented on the collected data to train the playback models.
Files
List of Components: List of Components
References
1. Colton, M. B., \& Hollerbach, J. M. (2007, March). Haptic models of an automotive turn-signal switch: Identification and playback results. In Second Joint EuroHaptics Conference and Symposium on Haptic Interfaces for Virtual Environment and Teleoperator Systems (WHC'07) (pp. 243-248). IEEE.
2. Colton, M. B., \& Hollerbach, J. M. (2007, April). Reality-based haptic force models of buttons and switches. In Proceedings 2007 IEEE International Conference on Robotics and Automation (pp. 497-502). IEEE.
3. Kuchenbecker, K. J., Fiene, J., & Niemeyer, G. (2005, March). Event-based haptics and acceleration matching: Portraying and assessing the realism of contact. In First Joint Eurohaptics Conference and Symposium on Haptic Interfaces for Virtual Environment and Teleoperator Systems. World Haptics Conference (pp. 381-387). IEEE.
4. Liu, Q., Tan, H. Z., Jiang, L., \& Zhang, Y. (2018, March). Perceptual dimensionality of manual key clicks. In 2018 IEEE Haptics Symposium (HAPTICS) (pp. 112-118). IEEE.
5. MacLean, K. E. (1996). The �haptic camera�: A technique for characterizing and playing back haptic properties of real environments. In Proc. of Haptic Interfaces for Virtual Environments and Teleoperator Systems (HAPTICS), 459-467.
6. Okamura, A. M., Webster, R. J., Nolin, J. T., Johnson, K. W., & Jafry, H. (2003, September). The haptic scissors: Cutting in virtual environments. In 2003 IEEE International Conference on Robotics and Automation (Cat. No. 03CH37422) (Vol. 1, pp. 828-833). IEEE.
7. Yim, S., Jeon, S., \& Choi, S. (2016). Data-driven haptic modeling and rendering of viscoelastic and frictional responses of deformable objects. IEEE transactions on haptics, 9(4), 548-559.
Appendix: Project Checkpoints
Checkpoint 1
Our Checkpoint 1 goals were to complete the mechanical and electrical design of our 1-DoF data driven haptic device; these goals were accomplished. Preliminary testing shows that the design is working as intended. Over the next couple of weeks we will be collecting data for various objects and building our data-driven model.
MECHANICAL DESIGN
The mechanical design of our device is similar to the HapKit as it is driven by a capstan drive with a transmission ratio of 20:1. For ease of data collection and haptic playback the capstan drive is oriented horizontally. The tip of the handle is a rotatable attachment that allows us to turn the force sensor upward or downward during the data-collection and playback periods. The CAD Assembly and 3D printed device are shown in Figures 1 and 2, respectively.
Figure 1. CAD of haptic device.
Figure 2. Haptic device.
ELECTRICAL DESIGN
The actuator is a brushed Maxon DC motor with a 14-bit magnetic encoder for position sensing. A 1-DoF Honeywell force sensor is placed on the end of the handle is used for data-collection and haptic playback. The schematic for the electrical design is shown in Figure 3.
Figure 3. Schematic of electronics.
Checkpoint 2
Our goals for checkpoint 2 were to create a functioning demo with pre-programmed buttons and compliant materials to feel. Over the past week we implemented the state machine and data processing for the sampled data. We tested our model on various buttons and played back the data amongst ourselves. This round of testing showed that we can accurately create the haptic feeling of interacting with buttons. By demo day, we plan to have real-time modeling and playback of different objects. We were not able to implement real-time modeling by Checkpoint 2 because we are still handling how to best handle filtering the data in Arduino. Originally we were planning to interface Arduino with Matlab or Python but decided it would be easiest to write and send data to the on-chip SD card.
Software
Serial communication was implemented for Arduino and Processing IDE, which is used for the UI. When certain buttons are pressed in the serial window of Processing, corresponding values will be sent to Arduino to trigger an event. The state diagrams are shown in Figure 4. Both Processing and Arduino begin in the "wait" state where the user has the option to collect or playback data for a given sample. When the user decides to sample data, Arduino will receive a signal from Processing and begin collecting data. The device will continue collecting data until the force sensor saturates or the user decides to stop sampling. This feature was implemented in case we run in any issues during the sampling period. In the playback state, the user also has the option to stop playing which allows them to return to the "wait" state.
Figure 4. State diagram for Arduino and Processing IDE.
TESTING
When the data is being collected, the force sensor is turned downwards to make contact with an object placed underneath. After the sampling period is over, the force sensor is turned upward and the filtered data is relayed back to the user as they press on the sensor. Figures 5 and 6 demonstrate this process.
Figure 5. Data collection for wall switch.
Figure 6. Playback for the wall switch.
The second round of testing shows that the device can accurately relay the haptic feeling of pressing on various buttons. We collected force vs. position data for a computer keyboard, wall switch, and lever switch. The filtered data is shown in Figures 7-10. This data was played back to the user while taking into account the force from the user's fingertip. Over the next few days we will be conducting user testing to further validate the accuracy of our model for different objects.
Figure 7. Processed data for computer keyboard.
Figure 8. Processed data for wall switch.
Figure 9. Processed data for lever switch.
Data Processing
After collecting sample data for an object, the data is processed to eliminate noise and repeated data points. A simple algorithm implemented in Arduino checks for repeated data points in the array of position values and removes them. Repeated data might occur from a large time step or the physical device stalling during data collection. Next, a moving average filter is applied to smooth out small fluctuations and emphasize the longer curves representative of the interaction with the sampled object.
User Interface
Our UI was created in Processing. The main page features two rows of five buttons and an additional row with five textfields. The top row of buttons are for sampling, i.e., the user can click this button to capture the force displacement curve of an object that he or she places underneath the 1 DoF haptic device. Before initiating sampling, an instruction pops-up and directs the user to orient the force sensor downwards and place the object underneath the device. Once the user clicks "Ready!" the device initiates the sampling process. Once complete, the UI returns to the main page. From here the user can either resample an object, continue to sample more objects, or click one of the playback buttons to virtually feel a sampled object. Before playback, an instruction pops-up and directs the user to orient the force sensor upwards and remove the object. Upon clicking "Ready!" playback starts and the user can terminate this mode at any time by clicking "Stop". Samples can be named by typing in the textfields and clicking enter, which populates the corresponding "Sampling" and "Playback" buttons with the user's desired identifier. Additionally, Processing communicates with Arduino to ensure that each program's respective states are synced up correctly. This synchronization is described in the above state machines. Below is a short demo video of the UI.