

2024-Group 1

Device in use at Open House.
Haptic Kong: Haptic Platform Game Using a Pantograph Controller
Project team member(s): Courtney Anderson, Mason LLewellyn, Trevor Perey, Kameron Robinson
Our project is a kelp forest platform game in which users are tasked with collecting sand dollars as fast as possible while encountering dynamically controlled obstacles. Users navigate the world using a vertical, 2-degree-of-freedom pantograph with haptic feedback. Our goals for the project were to create an engaging and competitive game for participants. We also aimed to enhance the user experience by creating a high-quality controller and user interface, including graphics and sounds. In the end, we presented our device at the ME 327 Open House where users provided positive feedback on the quality of the system and the entertainment they experienced while playing the game.

Group photo at open house
On this page... (hide)
Introduction
We created a platform game inspired by Super Mario Bros. as it allowed us to explore both interesting system dynamics and complex mechanical design. Our motivation for the project was to use basic force rendering in creative ways. We were also intrigued by the mechanical complexity of the pantograph and wanted to see if we could make a vertical pantograph which comes with its own set of challenges. The Haptic Kong game allowed us to achieve both of these educational goals.
The premise of our game is to collect four different coins as fast as possible. Each coin is collected after going around various obstacles including jellyfish springs, swirling currents, snail slime, and sea ice. Each of these obstacles has a different haptic effect to give users a wide array of feedback to make for a more interesting experience.
We further sought to enhance the experience by including custom-created graphics, game-like sounds, a coin counter, and a timer.
Background
Haptic Devices
Our work within this project is situated within a much larger field of design for haptic interfaces. The goal of these devices is to convey information to the user through computer-defined forces. This information is transferred through the device to the user and interference from the device itself must be minimized. The desired device conditions to minimize this interference are described in [1] and apply to the majority of haptic rendering devices. The conditions are as follows:
- High Structural Stiffness
- Low apparent Mass / Inertia
- Low backlash
- Low Friction
Depending on the forces the device is intended to render, and the final application of the device, there are a number of ways to achieve these goals.
Within [1] the authors introduce a general purpose haptic device whose main task is “free and unimpeded motion of the wrist”. To further simplify their design problem, they constrain the motion of the device to a single plane. Noting that serial manipulators suffer from high inertia and low stiffness as more serial links are added, they opted to create a parallel cartesian mechanism using two cable drives. To reduce friction due to drivetrain loss, the authors use stainless steel coated cables, low-friction brushed DC motors, and low-friction bearings. The final result was a lightweight, transparent device that can be used to render a number of arbitrary forces. For another solution to the problem of planar haptic rendering, we can look to the work in [3] in which the authors construct a pantograph for two-dimensional force rendering. This work specifically served as a useful reference to us as we constructed our own pantograph-based haptic rendering device. To ensure that the system remained rigid while maintaining low inertia, the authors constructed the majority of the device out of aluminum and strategically tapered and pocketed the arms of their pantograph device. To further make the device resistant to out-of-plane cantilever forces as the user presses on the end-effector of the device, the device’s end-effector has a tip that rests on a machined aluminum surface. The final device we discuss here is a low-friction joystick described in [4] that uses magnetic actuators both to cause the joystick to levitate and to render forces that can be felt by the user. This paper takes an extreme approach to reducing apparent inertia and friction due to drivetrain loss by physically separating the joystick itself from any other surface. The authors are able to use this joystick to render both stiff walls and stick-slip friction; however, this interesting setup is not without drawbacks. To enable the joystick to float, the magnetic actuators need to be actively controlled which increases the amount of computational load necessary to run the system over typical devices such as the pantograph and planar haptic devices mentioned previously.
Haptic Rendering
Within this project, we strive to render an expressive experience, not just visually but with touch. Both due to the computational limits of our Arduino and the physical constraints of our device, we are unable to render surfaces exactly as they appear and feel in reality. However, this limitation on realism does not mean that we cannot convey to the user what is happening within our experience. These limitations place our work within the larger field of non-photorealistic rendering. The idea of rendering information in a non-realistic but communicative way is an old one in the world of computer graphics and the same principles can be applied to haptic rendering. The authors in [2] take inspiration from cartoons, which convey information in a visually non-realistic way, and apply it to haptic rendering. The authors use “cartoon-inspired” rendering to render slippery surfaces, very stiff surfaces, and cliffs. To render slippery surfaces, the authors invert viscous friction force to create a model that speeds up the user rather than slowing them down. Especially for haptically rendered flat surfaces, this makes the “slipperiness” of the surface much more apparent than if forces were rendered using standard viscous friction. The authors also experiment with rendering stiff surfaces by adding additional oscillation forces after the user makes contact. This is similar to the vibration effect seen in cartoons when a character slams into a cartoon. Finally, the authors render “cliffs” (gaps in continuous surfaces) as a gap that is based on user awareness. When the user moves quickly over the gap, indicating a lack of awareness, they do not experience any force due to gravity. However, when they linger in the gap they experience downward force consistent with gravity. These forces, while not realistic, convey what is happening within the environment in a way that can be clearer and is simpler to render on a haptic device than a simulation of real friction forces.
Methods
Hardware Design and Implementation

CAD of the final pantograph

Final pantograph design
Our 5-bar linkage pantograph design is based on the work of a previous ME 327 group (https://charm.stanford.edu/ME327/2023-Group1) which created a more rigid and smooth pantograph based on the GraphKit from the CHARM Lab. This was achieved through redesigned links, and the use of more robust hardware including d-shafts, bushings, and shaft collars. These design choices were important to our project since speed is an important component of our game meaning, we needed to create a durable and reliable pantograph that could withstand fast, hard movements from users. Another useful improvement the previous group made was the expanded workspace. This was achieved through longer links and the fact that the driven links share an axis of rotation. This was important to our project as it allows the user more area to move in our game environment.
Our main design changes from the previous group include rotating the pantograph 90° to be oriented vertically, using motors with encoders for more accurate position tracking, and adding additional cross-members to limit out-of-plane bending. Throughout the design and prototyping of our system, we sought to reduce cost by using almost exclusively Hapkit components and hardware we already had.
We wanted to ensure we had accurate position tracking of the end-effector for both our dynamics study and to ensure that users could complete the game as fast as possible while being confident that their position was accurate. One of our large changes to the Haptic Air Hockey Simulation Device group pantograph was the use of motors with integrated encoders (https://www.pololu.com/product/4881). We chose to use these motors as they provided more accurate and reliable tracking of the rotations of the capstan. When using the motors and encoders, it was quickly determined that each encoder required two interrupt pins to obtain accurate readings. Since each Hapkit board only contains two interrupt pins, two Hapkit boards identified as a Leader and a Follower were used. The Follower simply read one encoder and transmitted these readings to the Leader via serial communication. The Leader then read its own encoder and used this information to render positions and forces. It was found that a 10 ms time delay was necessary between Follower encoder count transmissions to ensure that the data was properly received by the Leader
An additional complication for our project was the vertical aspect of our pantograph. While most horizontal pantographs limit out-of-plane bending by having the tip of the end-effector move across whatever surface the device is on, a vertical pantograph doesn’t have that same constraint. To limit out-of-plane bending, we added cross-members on either end of the shaft which the driven links rotate about to limit any vertical movement of the shaft. Additionally, we created new side panels that were properly oriented for our design and created stronger connections between the walls using angle brackets to make them more durable and able to withstand larger forces.
System Analysis and Control
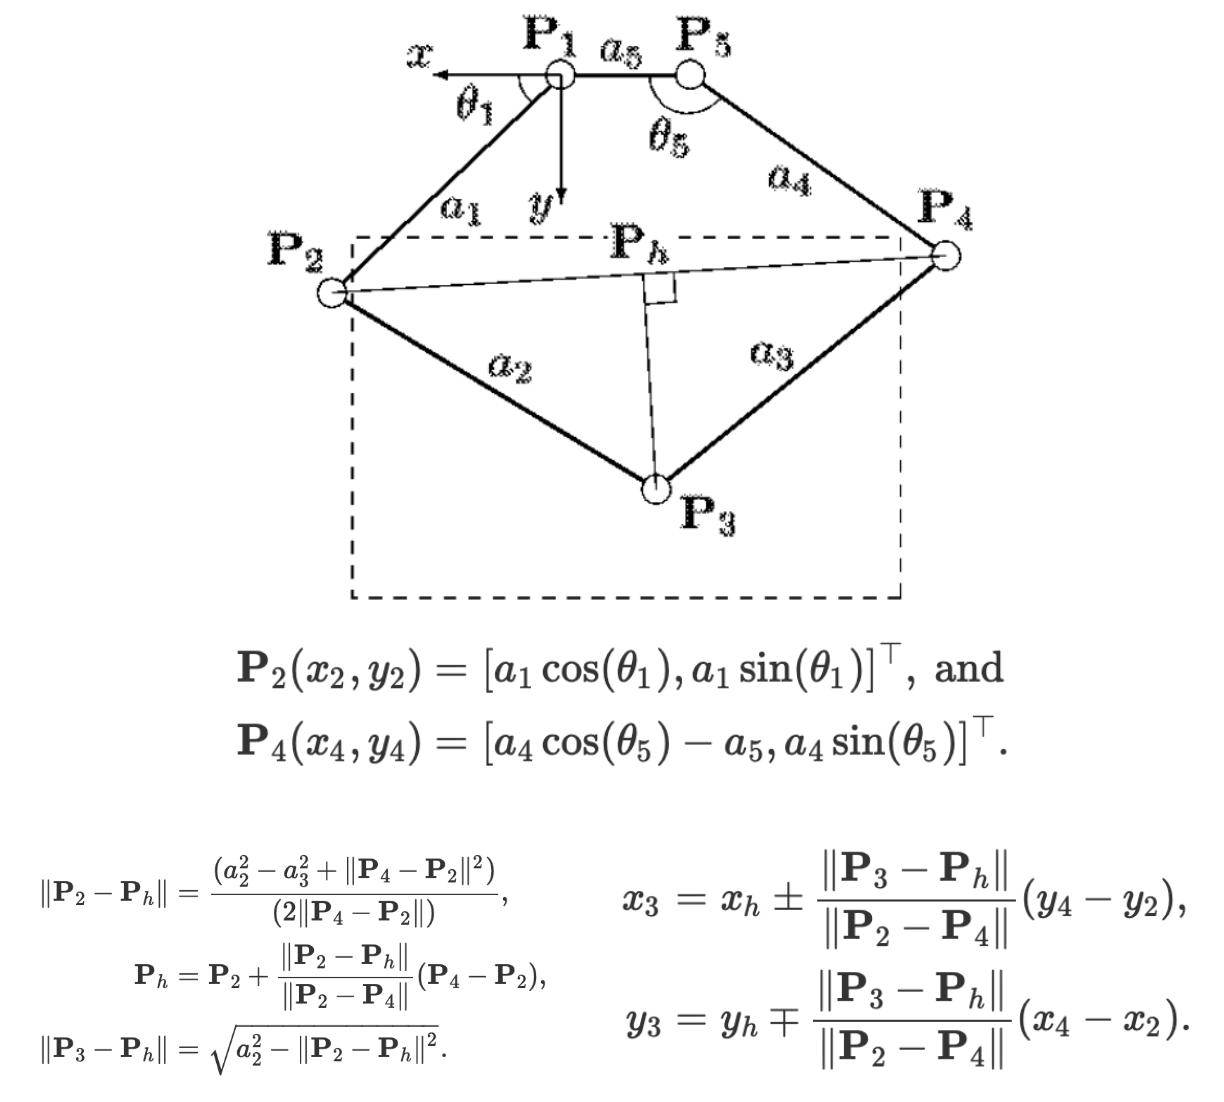
The kinematics were implemented by utilizing motor angle measurements obtained from the encoders and programming the equations below, which were reported by Campion, Wang, and Hayward [3].
Forces were then rendered using the transpose of the Jacobian by programming the equations below.
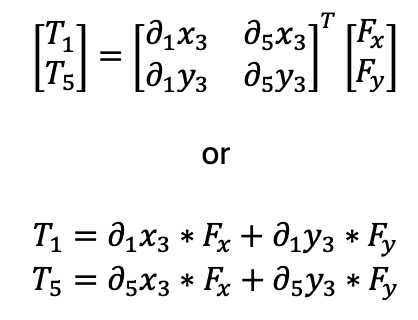
The partial derivatives were computed using the following equations, which were also reported by Campion, Wang, and Hayward [3].

Dynamics Study: Virtual Environment Analysis
A dynamics study on the obstacles rendered in the virtual environment was performed. The equations used to render forces with these obstacles are described below. To evaluate the efficacy of the force renderings and analyze the dynamics of the virtual environment further, data was collected from the Arduino and plotted for each obstacle.
In the following equations, the upper vector component corresponds to the horizontal x direction, and the bottom corresponds to the vertical y direction. That is,

Walls and Floors:
When the user enters a wall or floor, the control system analyzes the user’s prior and current position to determine the direction of entry and renders an opposing force accordingly. The algorithm used to determine entry direction and the corresponding force is summarized below:
Bottom Entry: If…
- The user’s current vertical position is greater than his or her previous position (i.e. moving up).
- The previous position was below the wall bottom.
Then the force is…

Top Entry: If…
- The user’s current vertical position is less than his or her previous position (i.e. moving down).
- The previous position was above the wall top.
Then the force is…

Left Entry: If…
- The user’s current horizontal position is greater than his or her previous position (i.e. moving right).
- The previous position was outside the wall’s left side.
Then the force is…

Right Entry: If…
- The user’s current horizontal position is less than his or her previous position (i.e. moving left).
- The previous position was outside the wall’s right side.
Then the force is…

For all equations above, a value of kwall = 1 N/mm = 1000 N/m was used. This value was tuned empirically to create a stiff wall without vibrations or instability. Notably, this is a larger stiffness than was typically rendered with the Hapkits since the motors used were capable of a higher maximum torque.
To verify this rendering produced the desired effect, data for the rendered force and user position was collected from the Arduino as the user pushed up against the floors at various points. This force data is plotted as a vector field below.

Figure 1: Vector field for rendered wall forces. Virtual floors are shown in green.
As seen in Figure 1 above, no force is rendered outside of the wall, and a force opposing the user is rendered appropriately when the user presses on any side of the wall. Larger forces are indicative of a user pressing harder on the wall and entering further into the wall as expected.
Whirlpool:
The whirlpool is intended to push the user in a counterclockwise circular motion within its boundaries. To achieve this, the whirlpool forces were rendered as sinusoidal functions of the user’s horizontal position according to the equations below:

xwhirl, r and xwhirl, l are the left and right horizontal boundary positions for the whirlpool respectively. A value of Awhirl = 2.0 N was chosen based on empirical tuning and led to an effect which was noticeable but not excessively strong or unstable.
As with the walls, to verify this rendering, force and position data was collected from the Arduino as the user traversed through the whirlpool and plotted as a vector field below.

Figure 2: Vector field for whirlpool forces. The scale is such that only the region of the virtual environment near the whirlpool is shown. The first virtual floor is shown in green.
As shown in Figure 2 above, the rendered forces push the user in a circular motion only within the whirlpool region as desired.
Sticky Snail Slime:
The sticky sea snail slime is rendered as viscous damping, so the trick to get through this obstacle with the least amount of resistance is to move slowly. The slime force was rendered according to the equation below:

A value of bslime = 0.0003 N-s/mm = 0.3 N-s/m was chosen based on empirical tuning and led to a strong damping force without excessive vibration, especially when stationary within the region.
To assess the system dynamics associated with the slime, data for the user’s velocity as well as the force rendered was collected over time from the Arduino as the user passed horizontally in and out of the region. The horizontal user velocity and rendered slime force are plotted over time below.

Figure 3: Horizontal force and velocity within the slime region.
As seen in Figure 2 above, the user’s horizontal velocity, and thus the rendered force, fluctuates rapidly. This is likely due to shortcomings associated with the velocity approximation, despite the fact that the filtering algorithm from the course’s assignments was used. To visualize system dynamics trends more clearly, the data was smoothed using MATLAB’s smooth function, which employs a moving average. The smoothed horizontal and vertical velocities and forces are plotted below.


Figure 4: Smoothed force and velocity components within the slime region.
From the smoothed plots in Figure 4, it is apparent that the force rendered is proportional in magnitude and opposite in direction to the user’s velocity. Regions where the force is zero are associated with times when the user exits the slime. Moreover, interestingly, it can be seen from the plot of horizontal components that the slime causes the user to slow upon entry as expected. Speeds and forces are lower in magnitude in the vertical direction since data was collected while passing mostly horizontally through the slime. Together, these plots show that the slime rendering leads to the desired dynamics.
Slippery Sea Ice:
The sea ice region force is determined by the user’s velocity, similar to the snail slime, except that the force amplifies velocity instead of damping it. This controller was inspired by Gleeson and Johnson [2], and the force was rendered per the equation below:

A value of bice = 0.00075 N-s/mm = 0.75 N-s/m was chosen based on empirical tuning and led to a noticeable but not overpowering slipping sensation.
As with the slime, force and velocity data were gathered from the Arduino as the user moved horizontally back and forth across the ice. This data was smoothed and plotted below.


Figure 5: Smoothed force and velocity components in the icy region.
As seen in Figure 5 above, the force rendered is proportional to and in the same direction as the user’s velocity. No force is rendered when the user exits the icy region as anticipated. Analogous to the slime, the horizontal component plot indicates that the user speeds up noticeably when he or she enters the icy region as expected. Overall, the figure demonstrates that the rendering produced the expected dynamics.
Jellyfish Trampolines:
Bouncing on the jellyfish was intended to push the user up to the next level. To achieve this, a constant force was continuously rendered after the user touched a jellyfish until they crossed the bottom or sides of the next level. The constant forces rendered were the following:

The number in the subscript indicates the floor nearest to where the associated jellyfish was located.
As with the walls and whirlpool, data for the rendered force and user position was collected from the Arduino as the user interacted with the jellyfish. This data was plotted as a vector field below.

Figure 6: Vector field for jellyfish forces.
As displayed in Figure 6 above, a constant force was rendered on the user pushing them towards the next level until they reach this level as desired.
Graphics and Sounds


To render the game we used the Processing visual coding environment. The kelp forest visuals were created on pixilart.com and the sound effects were downloaded from pixabay.com. We were inspired by the Super Mario games, but wanted to add our own personal theme and twist, so we chose to let the user explore a kelp forest! The critters in the environment are all real species you can find along California’s coast, with a special focus on our local Monterey Bay.
The sound effect which seemed most important to helping the user understand the purpose of the game was the coin pickup sound. Often gamers jumped right into the game and didn’t immediately understand the purpose, but after collecting one sand dollar, hearing the coin pickup sound, and seeing the sand dollar count increment, our game’s intention became immediately apparent. The ambient underwater sounds were intended to immerse the player in the kelp environment; unfortunately the music in the atrium drowned it out a bit. Once the user collected all four coins, a satisfying finish line sound would play and the timer would stop. Users were free to explore the forest after completing the task, to get more time with the haptic obstacles we created. To reset between games we just had to click a key on the keyboard to reset the timer, coin count, and return to the welcome screen.
The Processing code used the Serial monitor to read in the x and y position from the pantograph and render that as the cursor position on the screen. Similar to the Arduino code, the program needed to know the entry side of the cursor when it penetrated floors/walls to know where to render the proxy position. This was implemented by looking at the previous position of the cursor and comparing it to the current position of the cursor. No proxy position code was needed for any of the haptic regions.
Results
A video showing the use of our device during the final demonstration is located here: https://www.youtube.com/watch?v=wLIsX5fM4sE
The average completion time for the game was approximately 31.99 seconds though many users initially just explored the world rather than trying to collect coins.

Final game in use
Users reported having fun while playing our game and many people played multiple times to beat their previous score. Users enjoyed the different effects with the whirlpool being a favorite. Participants noted that the forces felt were strong, which was possible since higher-torque motors were used than the original Hapkit motors.
We also noticed that some users were able to “cheat” the game by avoiding the obstacles which we may want to address in future iterations.
Furthermore, we noticed that different users held onto the handle with amounts of force causing the device to jump out of some user's hands on the sea ice and the whirlpool. It was also clear that grabbing the handle wasn’t immediately intuitive to some users.
Future Work
Though our design achieved many of our initial goals, we identified several opportunities for improvement in future work. To enhance the user experience, we would like to create an avatar for the user so that they have a character they can refer back to (i.e. Mario, Donkey Kong Sonic the Hedgehog, etc.). We would also like to include an integrated leaderboard into our graphics so that users can compare and motivate their performance in the game, creating a more arcade-like experience. Additionally, we would like to create a more complex game by adding more coins to collect and additional obstacles to avoid to create a more fun and challenging game.
In regard to hardware design, we would like to find a way to permanently attach the Arduino boards to the box, add front and back walls as well as a lid to fully enclose the box, and add a better end-effector handle for the user to have an easier time navigating the world.
On rare occasions, drift in the user’s position was seen, and the program needed to be reset to return the user to the appropriate starting position. This was believed to be due to occasional slip in the capstan drive when large forces were rendered, which caused changes in encoder readings without changes in user position. To prevent this in the future, a more robust pulley system that incorporates grooves for the capstan cable could be used.
Regarding force renderings, the user often felt bumps and vibrations when dragging along the rendered walls. Further testing and development could be done to eliminate these bumps, potentially through tuning of the wall stiffness or increased code efficiency leading to higher loop speeds and thus more rapid updates in rendered forces. Moreover, a more interesting and realistic slime damping force could be achieved through development and experimentation which seeks to eliminate velocity estimate variability. This could be achieved through experiments that more accurately determine loop speed or employ Arduino timers for determining loop speed. In addition, a more effective filtering algorithm or a moving average such as that used by the Arduino smooth function could be employed. Finally, the jellyfish trampoline force could feel unrealistic when the user resisted motion toward the next level. These renderings could be improved with further experimentation, potentially by employing a force that decays with time.
Acknowledgments
Thank you to the Haptic Air Hockey Simulation Device group from 2023 including members: Max Ahlquist, Dani Algazi, Luke Artzt, Ryan Nguyen.
Thank you to the CHARM lab for tools for prototype assembly and testing.
Files
The Arduino Leader code is included in the ZIP folder below. Attach:LeaderCode_ME327_Team1Spring2024.zip
The Processing code is included in the ZIP folder below. Attach:ProcessingCode_ME327_Team1Spring2024.zip
The Arduino Follower code is included in the ZIP folder below. Attach:FollowerCode_ME327_Team1Spring2024.zip
Text files containing the collected data are included in the ZIP folder below. Attach:CollectedData_ME327_Team1Spring2024.zip
The CAD assembly files are included in the file below. Attach:Full_Assembly_2024_v18.zip
The Bill of Materials is included in the file below. Attach:Bill_of_Materials-Sheet1.pdf
The full demo video is included below. Attach:IMG_9701.mov
References
[1] Ellis, R.E., Ismaeil, O.M., & Lipsett, M.G. (1996). Design and evaluation of a high-performance haptic interface. Robotica, 14, 321 - 327., https://www.semanticscholar.org/paper/Design-and-evaluation-of-a-high-performance-haptic-Ellis-Ismaeil/b592dee9dddad2199beb31aafc4426640adb7e42
[2] B. Gleeson and D. E. Johnson. "Expressive haptic rendering with cartoon-inspired effects." 2010 IEEE Haptics Symposium, Waltham, MA, USA, IEEE, 26 Mar. 2010, pp. 191-194, doi: 10.1109/HAPTIC.2010.5444656, https://ieeexplore.ieee.org/document/5444656.
[3] G. Campion, Qi Wang and V. Hayward, "The Pantograph Mk-II: a haptic instrument," 2005 IEEE/RSJ International Conference on Intelligent Robots and Systems, Edmonton, Alta., 2005, pp. 193-198, doi: 10.1109/IROS.2005.1545066, https://ieeexplore.ieee.org/document/1545066.
[4] Oh, S., Hollis, R.L., & Salcudean, S.E. (1997). On the Emulation of Stiff Walls and Static Friction with a Magnetically Levitated Input/Output Device., https://www.semanticscholar.org/paper/On-the-Emulation-of-Stiff-Walls-and-Static-Friction-Oh-Hollis/420f3a5a82d7ac0571e2db876671a0ef65cfd840
Appendix: Project Checkpoints
Checkpoint 1
Goals
The goals for this week were the following:
- Construct an initial, functional prototype of the vertical pantograph system.
- Complete an initial draft of the dynamics study of the system.
- Implement the system’s new motors and encoders and create the initial code for force and position mapping.
Fabrication
This week, we created our first prototype of our vertical pantograph system. The system uses much of the Hapkit hardware but has different motors and linkages. Much of the design is based on the Haptic Air Hockey Simulation Device with modifications specific to our application. There are a few known issues related to tolerances and lack of proper hardware which we plan to improve on in the next iteration. The device will soon be tested to see how well it functions to determine what other modifications are necessary.

Motors, Encoders, and Mapping
When beginning to implement the motors and encoders, the first discovery made was that each encoder required two Hapkit board pins with interrupt capabilities to acquire accurate readings of the motor shaft position. Consequently, the first step in implementing the encoders was to utilize two Hapkit boards: A leader board, which reads one encoder, receives the other encoder’s position from the follower, does all position and force mapping computations, and drives both motors A follower board, which reads one encoder and transmits its position to the leader.
With this allocation made, software was then written to read the encoders and allow for serial data transmission of the follower encoder’s position to the leader. With this completed, the encoders were successfully implemented.
Next, position and force mapping were implemented and tested in a virtual environment created in Processing. The current Leader and Follower software programs and the Processing virtual environment program used to implement this mapping are attached below:
Attach:VerticalPantograph_052324
Position Mapping
Position mapping was implemented using the kinematics shown below.
To test position mapping, the user’s calculated position was plotted as a circle on the screen. A successful test of position mapping is shown in the video below.
https://www.youtube.com/watch?v=or_WsNfaqP8&feature=youtu.be
As seen in the video, the user’s virtual position on the screen appears to accurately track the position of the pantograph’s end effector. This set-up was then used to determine the limits of the pantograph’s motion. To do so, the pantograph was moved along the edge of its motion, and its position was recorded. This position data is plotted below.

Figure 1: Vertical pantograph limits.
As seen in the plot above, the pantograph has greater mobility in the horizontal direction than it does in the vertical direction. Based on this information, moving forward, the virtual environment must be rendered to remain within the limits shown.
Force Mapping
Next, force mapping was implemented using the equations shown below.

Furthermore, to compute the duty cycle required to achieve the computed torques, it was noted that under steady-state stall conditions, the current through the pantograph motors and thus the motor torques are expected to be proportional to the voltage applied to the motor. Consequently, it was assumed that the required duty cycle could be approximated as a fraction of the maximum stall torque using the formula below.

To test this assumption, a plot of duty cycle against motor torque was generated by hanging weights from the motor and measuring the duty cycle required to balance this weight as shown below.

The resulting plot is provided below.

Figure 2: Plot of duty cycle versus torque for the employed motors.
The slope of this plot is very similar to the reciprocal of the maximum stall torque, supporting the expectation that the duty cycle formula above can generate that required to produce a desired torque. To test this, a simple virtual horizontal wall located at y = 185 mm was added to the Arduino and Processing programs. A video testing this virtual wall is shown below.
https://www.youtube.com/watch?v=8aT80ucalGI
As seen in the video, the pantograph generates the appropriate force to give the user the sensation of a virtual wall. It was noted that the pantograph could lift off the table when the user pressed up on the wall, so a means of holding the pantograph down shall be added to the next design. Moreover, when running along the wall, some bumps and vibrations could be felt. This indicates that parameters such as stiffness for the obstacles in the team’s final virtual environment must be carefully tuned.
Checkpoint 2
Goals
The goals for this week were the following:
- Construct an improved pantograph design
- Complete implementation of calibration, position mapping, and rendering of basic obstacles
- Implement initial graphics with basic obstacles (i.e. walls)
Fabrication
After the construction of our prototype last week, we determined several areas of improvement. First, we created new side panels for the pantograph that are compatible with the hardware we have available and included holes for suction cups to adhere the device to a table. We also improved the fit of the holes for the bushing to help reduce out of plane motion. Another way we reduced out of plane motion was through the addition of two more cross supports on the ends of the shafts. To create smoother motion between the links, we remade the links to use Ľ” D-shafts at each joint rather than the square axles we were using before. Finally, we created new neoprene shaft adapters which will provide better transmission of motion from the motor to the capstan. The new prototype is mostly assembled aside from the new bottom plate which we are awaiting fabrication for

Calibration, Position Mapping, and Rendering of Basic Obstacles
Position mapping was successfully implemented for Checkpoint 1. Additionally, it was noted from the plot showing the range of motion of the pantograph in Checkpoint 1 that the pantograph can be easily set in an initial starting position near approximately "x" = 0 mm, "y" = 120 mm. In fact, the pantograph naturally falls into this position under the force of gravity when not held by the user. Consequently, use of the pantograph can always be started from this position, accomplishing an initial position calibration without needing additional hardware or software.
Wall Rendering
Wall forces were rendered as simple forces with magnitudes proportional to the user’s penetration depth. The direction was set by determining which side of the wall the user entered based on the user’s prior position. If the user crosses the top or bottom and was already within the horizontal limits of the wall, it is known that they entered vertically, and the force can be rendered in the opposite vertical direction. Similarly, if the user crosses the left or right side of the wall but was already within the wall’s vertical limits, it is known that they entered the wall horizontally. Demonstration of this wall rendering can be seen in the video below.
As seen in the video above, the forces are appropriately rendered on the top, bottom, left, and right for all walls in the virtual environment. Currently, the user can be seen penetrating the wall; this is to be prevented moving forward in the Processing program. Furthermore, it can be seen that the motion of the pantograph is not perfectly smooth at times. This is because one of the pulleys is not properly sized to the motor and is thus not perfectly concentric with the motor shaft. This was a known issue resolved with the new neoprene shaft adapters in the updated prototype.
Obstacle Rendering
Special obstacles representing wind, spiderwebs, and ice were also rendered. These can be seen in the video below.
As seen in the video above, each obstacle produced the expected haptic sensation. The wind, which is present in the leftmost colored box, was represented as a constant force pushing the user out of the windy area with a combined damping component which increases the force if the user pushes against the wind or relaxes the force to a limit of 0 if the user moves away from the wind. Furthermore, the spiderwebs, which were present in the rightmost colored box, were rendered as a damping force which caused the user to feel stuck in this region. Finally, the ice, which was created in the topmost colored box, caused the user to slip rapidly out of the icy region. This can be used for an interesting game element requiring the user to grab a coin in the center of the region by approaching from the correct angle.
Trampoline Rendering
The trampoline, which was created in the bottom region adjacent to the user’s starting position, was rendered to apply a constant force pushing the user up toward the next wall. A video showing the user dropping the pantograph on the trampoline can be seen below.
As displayed in the video, the trampoline does produce a bouncing effect, but its duration is short. Moving forward, the trampoline shall be rendered such that when the user touches it, a force shall be continuously applied to move the user to the next level.
"'Graphics"
We were able to use basic graphics of walls and haptic regions to calibrate the dynamics equations described above. With the basics finished, now we will move towards refining the graphics experience. In the next few days we hope to have the coin collecting task rendered, the proxy position rendered for the hard floors, as well as stylized levels and backgrounds for the special regions. If we get that complete, we will add sound effects.
